View or edit on GitHub
This page is synchronized from trase/models/brazil/soy_2023_2024_v27/qa/model_v2_7_outputs.md. Last modified on 2026-11-02 10:41 CET by dependabot[bot].
Please view or edit the original file there; changes should be reflected here after a midnight build (CET time),
or manually triggering it with a GitHub action (link).
Brazil soy v2.7.0: output quality for 2023–2025
- Key takeaways
- Follow-ups
- Analytical scope
- Data consistency
- Total volume
- Totals by top 5 exporters
- Decision tree results
- Top traders
- Municipality of production
- Unknown municipality of production
- Unknown municipality of production, by trader
- Unknown municipality of production, by branch
- Version benchmarking (v2.6.1 vs v2.7.0)
- Municipality of production: what moved
The quality-assurance report for the Brazil soy v2.7.0 supply chain model, covering the three export years it produces: 2023, 2024 and 2025. It asks whether the output is fit to publish, and closes by benchmarking v2.7.0 against v2.6.1 on 2022 — the one year run through both versions, for comparison only and not for release.
For the same model seen over a longer span, and for how these quantities
move across the version boundary from 2019 to 2025, see
model_v2_6_to_v2_7_trends.
Key takeaways
- Volume and FOB survive the model exactly. Both match the bills of lading to the tonne and the dollar in 2023, 2024 and 2025, once domestic flows are set aside. The supply-shed solution redistributes volume across geographies; it neither creates nor destroys any.
- v2.7.0 places soy in substantially more municipalities than v2.6.1 did. On the same 2022 shipments it maps 2,055 municipalities against v2.6.1’s 1,795, and cuts the volume it cannot place at all from 23.0% to 1.1%. Western Bahia and south-eastern Goiás gain most; a band of central Mato Grosso municipalities gives volume up. This is the clearest improvement the rebuild delivers.
- The largest single category is not a link at all. Flows whose
logistics hub was allocated statistically — the
6.1and6.2branches — carry more volume than any kind of direct facility match, and the share grows every year from 2023 to 2025. These should not be read as traced volume. - Only 3.8% of 2023 export volume and 3.9% of 2024’s has no
municipality of production, against 17–23% under v2.6.1. 2025 is
worse, at 5.7%, though still far below v2.6.1. What remains is
concentrated: branch
2.2fails almost every time and is the largest single source in 2023 and 2024, and in 2025 the6.1allocation overtakes it — its own failure rate roughly doubles, to 5%, on the biggest branch in the tree. - Traders differ far more than the national total suggests. Amaggi and Coamo are largely traced from their own facilities; ADM, CHS and Olam rest mostly on the allocation. The spread is not a size effect — the largest exporters sit at both ends of it.
Follow-ups
- Reduce the share of volume reaching branch
6.1. It is the biggest branch and its hubs are allocated statistically rather than matched to a facility, so anything that moves flows out of it turns allocated volume into traced volume. - Explain why branch
2.2almost never resolves an origin. Nearly all of its volume ends with an unknown municipality, in every year. It is a small branch, so this is a correctness question rather than a coverage one. - Find out why branch
6.1resolves less in 2025. Its unresolved share goes from about 3% in 2023 and 2024 to 5% in 2025, which accounts for more than half of the rise in unknown-origin volume. The branch carries a similar share of the year’s exports (44% in 2024, 46% in 2025), so this is mostly a change in what the supply shed can place, not in how much reaches the allocation. - Chase the municipalities that fall to exactly zero between v2.6.1 2022 and v2.7.0 2023 — a producer of that size disappearing from the map is more likely to be a coverage artefact than a real sourcing change.
- Look into the cake and oil crushing geography, which the SECEX comparison finds is where most of the remaining divergence with customs data sits.
Analytical scope
This notebook evaluates the model across four dimensions:
- Data consistency: validates that the end-to-end model outputs — total exported soy volumes, FOB values, and top trader totals — reconcile with the baseline customs data (Bills of Lading).
- Decision tree diagnostics: how soy volume is allocated across the model’s decision-tree branches, grouped by the kind of evidence behind each one, both nationally and per trader.
- Traceability gaps: the volume of soy exports whose production municipality could not be identified, broken down by year, trader and branch.
- Version benchmarking (v2.6.1 vs v2.7.0): a like-for-like comparison on 2022 data, measuring shifts in decision-tree logic and in municipality-level traceability.
It relies on the following datasets, all on S3:
- v2.7.0 supply chain results:
brazil/soy/sei_pcs/v2.7.0/SEI_PCS_BRAZIL_SOY_{year}_TMP_1000.parquet - v2.6.1 supply chain results:
brazil/soy/sei_pcs/v2.6.1/SEIPCS_BRAZIL_SOY_2022.csv - Bills of Lading:
brazil/trade/bol/{year}/gold/brazil_bol_{year}_gold.parquet
Data consistency
Total volume
Total soy export volume and FOB values are preserved after running the model end-to-end.
| Object | Version ID | Last modified |
|---|---|---|
s3://trase-storage/brazil/trade/bol/2023/gold/brazil_bol_2023_gold.parquet |
E9sFBuMeSInVNPuPXI_XJMKPPb3i13_F | 2026-10-17 13:45:12 UTC |
s3://trase-storage/brazil/trade/bol/2024/gold/brazil_bol_2024_gold.parquet |
49We3kibr5o7WP0v3x0oqhNqXx80m62J | 2026-10-17 13:48:26 UTC |
s3://trase-storage/brazil/trade/bol/2025/gold/brazil_bol_2025_gold.parquet |
OE6NTLh4_cv3fuG6RsD.LJUx7Gj3DxsW | 2026-10-17 13:48:36 UTC |
s3://trase-storage/brazil/soy/sei_pcs/v2.7.0/SEI_PCS_BRAZIL_SOY_2023_TMP_1000.parquet |
J4j9QeEVWuOYGNlwvRRQ7_sJZed6z80O | 2026-10-22 09:41:05 UTC |
s3://trase-storage/brazil/soy/sei_pcs/v2.7.0/SEI_PCS_BRAZIL_SOY_2024_TMP_1000.parquet |
.SobUbj41xvNYY7.tEQufpySD_7tgWca | 2026-10-22 10:12:58 UTC |
s3://trase-storage/brazil/soy/sei_pcs/v2.7.0/SEI_PCS_BRAZIL_SOY_2025_TMP_1000.parquet |
T15kbwANcb_WKf2vgWx2zx_T36xsJncK | 2026-10-22 10:59:51 UTC |
s3://trase-storage/brazil/soy/sei_pcs/v2.7.0/SEI_PCS_BRAZIL_SOY_2022_TMP_1000.parquet |
FXrrpCCz6xGPHuXMdKCPz0VLC.rupqOL | 2026-10-02 08:23:48 UTC |
s3://trase-storage/brazil/soy/sei_pcs/v2.6.1/SEIPCS_BRAZIL_SOY_2022.csv |
xuOHKnMaFoB9AswGCj3U_O_1wI_GPQiz | 2026-06-18 14:42:20 UTC |
| Year | Domestic volume (t) | Share of model output (%) |
|---|---|---|
| 2023 | 34,900,000 | 23.1 |
| 2024 | 26,700,000 | 18.6 |
| 2025 | 35,000,000 | 21.3 |
This is the volume set aside before the comparison below.
| Year | BoL volume (t) | Model volume (t) | Volume diff (%) | BoL FOB (USD) | Model FOB (USD) | FOB diff (%) |
|---|---|---|---|---|---|---|
| 2023 | 116,366,730 | 116,366,730 | -0.0000 | 99,783,321,698 | 99,783,321,697 | -0.0000 |
| 2024 | 116,746,129 | 116,746,129 | -0.0000 | 59,768,135,891 | 59,768,135,890 | -0.0000 |
| 2025 | 128,966,787 | 128,966,787 | -0.0000 | 52,099,945,250 | 52,099,945,249 | -0.0000 |
Both columns match to within rounding, in every year. Note that this holds only once domestic flows are set aside: compared against the whole model output the volume difference would be +30% in 2023, +23% in 2024 and +27% in 2025, which is the domestic flow and not a reconciliation failure.
Totals by top 5 exporters
| Year | Exporter group | BoL volume (t) | Model volume (t) | Volume diff (%) | BoL FOB (USD) | Model FOB (USD) | FOB diff (%) |
|---|---|---|---|---|---|---|---|
| 2023 | CARGILL | 16,083,615 | 16,083,615 | -0.0000 | 10,090,690,220 | 10,090,690,220 | -0.0000 |
| 2023 | BUNGE | 15,027,234 | 15,027,234 | -0.0000 | 10,445,569,935 | 10,445,569,935 | -0.0000 |
| 2023 | ADM | 12,585,005 | 12,585,005 | -0.0000 | 6,742,941,351 | 6,742,941,351 | -0.0000 |
| 2023 | COFCO | 9,804,453 | 9,804,453 | -0.0000 | 7,591,177,839 | 7,591,177,839 | -0.0000 |
| 2023 | AMAGGI | 8,708,678 | 8,708,678 | -0.0000 | 6,600,338,465 | 6,600,338,465 | -0.0000 |
| 2024 | CARGILL | 16,271,771 | 16,271,771 | -0.0000 | 7,033,286,448 | 7,033,286,448 | -0.0000 |
| 2024 | BUNGE | 15,812,998 | 15,812,998 | -0.0000 | 6,896,218,749 | 6,896,218,749 | -0.0000 |
| 2024 | UNKNOWN | 12,002,756 | 12,002,756 | -0.0000 | 5,707,439,901 | 5,707,439,901 | -0.0000 |
| 2024 | ADM | 10,752,116 | 10,752,116 | -0.0000 | 4,248,717,878 | 4,248,717,878 | -0.0000 |
| 2024 | COFCO | 10,319,783 | 10,319,783 | -0.0000 | 4,436,174,452 | 4,436,174,452 | -0.0000 |
| 2025 | UNKNOWN | 22,024,810 | 22,024,810 | -0.0000 | 9,032,215,378 | 9,032,215,377 | -0.0000 |
| 2025 | BUNGE | 19,768,325 | 19,768,325 | -0.0000 | 8,127,994,492 | 8,127,994,492 | -0.0000 |
| 2025 | CARGILL | 16,129,186 | 16,129,186 | -0.0000 | 6,660,827,910 | 6,660,827,909 | -0.0000 |
| 2025 | COFCO | 10,249,628 | 10,249,628 | -0.0000 | 4,092,419,505 | 4,092,419,505 | -0.0000 |
| 2025 | ADM | 9,448,781 | 9,448,781 | -0.0000 | 3,596,391,575 | 3,596,391,575 | -0.0000 |
Decision tree results
Each flow reaches the model through one decision-tree branch, and those
branches differ in how much evidence sits behind them. Grouped by that —
the linkage column added when the data is loaded — the picture is:
| Linkage | 2023 (%) | 2024 (%) | 2025 (%) |
|---|---|---|---|
| Direct link to farm or silo | 22.1 | 22.0 | 21.1 |
| Direct link to crushing facility | 8.7 | 7.2 | 5.8 |
| Link to exporter’s office | 7.9 | 7.9 | 6.4 |
| Allocated from sourcing patterns | 37.8 | 43.8 | 44.8 |
| Domestic consumption | 23.1 | 18.6 | 21.3 |
| Unknown - missing information | 0.4 | 0.4 | 0.6 |
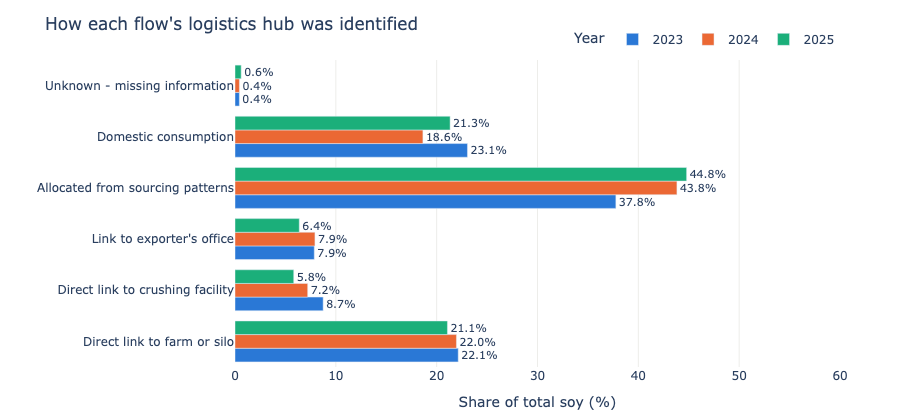
Direct links to a physical facility — a farm, silo or crushing plant matched on CNPJ — account for 30.9% of total soy in 2023, 29.2% in 2024 and 26.9% in 2025. On export volume alone, which is the basis the previous model was reported on, that is 40.1%, 35.9% and 34.2%. The direct share falls a little every year.
The largest single category, though, is allocated from sourcing
patterns — the 6.1 and 6.2 branches, at 37.8%, 43.8% and 44.8% of
total soy. These flows have no matched hub at all: they are spread
across silos or crushers using the MDIC state of origin and the sourcing
pattern of the flows that were matched. They are where the unknown
production origins in the next section
mostly come from.
Top traders
The same breakdown, per trader, as a share of each trader’s own export volume. Domestic flows are excluded here so that the pseudo-exporter the model uses for them does not take one of the ten slots.
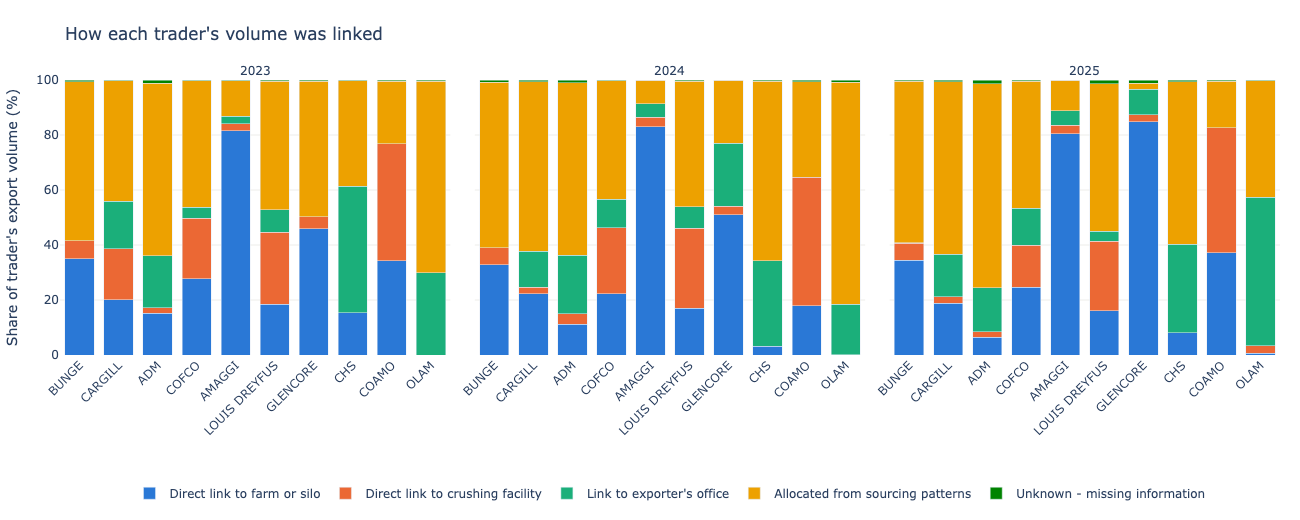
Amaggi and Coamo are largely traced: 84% and 77% of Amaggi’s and Coamo’s 2023 export volume has a direct facility link, Amaggi improves again to 86% in 2024, and both are back at 84% and 83% in 2025. Both are Brazilian companies with their own origination networks, which is the likeliest explanation — their CNPJs match facilities in the registries the model uses. Glencore joins them in 2025, at 87% direct, but on a much smaller volume than in earlier years, so that is as likely to be a change in which of its shipments it exports under its own name as a change in the model.
ADM, CHS and Olam are at the other end, with the statistical allocation carrying 62%, 65% and 81% of their 2024 volume and direct links under 16%. ADM moves further that way in 2025, to 74% allocated and 8% direct. Cargill is the notable mover: direct links fall from 39% of its volume in 2023 to 25% in 2024 and 21% in 2025, with the allocation rising from 44% to 62% and then holding at 63%.
For most of the majors the allocation is the single largest category. That is the important qualification on any trader-level sourcing figure taken from this model: for several of these companies, most of the map is inferred from their MDIC state of origin and other traders’ observed patterns, not from their own declared facilities.
Municipality of production
This section focuses on the results of the supply shed model by checking the percent of unknown municipality of production across years, traders and branches.
Unknown municipality of production
After running the model end-to-end, 4.0% of 2023 soy exports, 4.2% of 2024 exports and 5.3% of 2025 exports remain associated with a municipality of unknown origin. Where the model cannot assign an origin this is mainly its distance cutoffs, which stop it assigning one when that would require an unfeasibly long transport journey. To define those thresholds we used CONAB’s freight dataset to estimate the average distance commodities travel within each state.
These are small shares: the same measure runs at 17–23% through the v2.6.1 years (see the trends notebook). They are not stable, though: 2025 sits about half as high again as the two earlier years. The breakdown by branch below shows where the remainder comes from, and where the 2025 increase does.
Note that the percentages in this section are shares of export volume: domestic flows are excluded, as everywhere else in this notebook, because including them would inflate the denominator and understate the gap.
| Year | Municipality of production | Volume (t) | Year total (t) | Share (%) |
|---|---|---|---|---|
| 2023 | KNOWN | 112,000,000 | 116,000,000 | 96.0 |
| 2023 | UNKNOWN | 4,680,000 | 116,000,000 | 4.0 |
| 2024 | KNOWN | 112,000,000 | 117,000,000 | 95.8 |
| 2024 | UNKNOWN | 4,850,000 | 117,000,000 | 4.2 |
| 2025 | KNOWN | 122,000,000 | 129,000,000 | 94.7 |
| 2025 | UNKNOWN | 6,810,000 | 129,000,000 | 5.3 |
Unknown municipality of production, by trader
| Year | Exporter group | Unknown-origin volume (t) | Trader’s export volume (t) | Unknown (%) |
|---|---|---|---|---|
| 2025 | UNKNOWN | 1,670,000 | 22,000,000 | 7.6 |
| 2025 | BUNGE | 1,010,000 | 19,800,000 | 5.1 |
| 2024 | CARGILL | 21,000 | 16,300,000 | 0.1 |
| 2025 | CARGILL | 8,200 | 16,100,000 | 0.1 |
| 2023 | CARGILL | 19,700 | 16,100,000 | 0.1 |
| 2024 | BUNGE | 1,440,000 | 15,800,000 | 9.1 |
| 2023 | BUNGE | 1,290,000 | 15,000,000 | 8.6 |
| 2023 | ADM | 29,600 | 12,600,000 | 0.2 |
| 2024 | UNKNOWN | 331,000 | 12,000,000 | 2.8 |
| 2024 | ADM | 210,000 | 10,800,000 | 2.0 |
Unknown municipality of production, by branch
Branch 2.2 (link to silo cadastro) has by far the highest rate: almost all of its volume ends up with an unknown municipality of origin — 93% in 2023, 99% in 2024 and 83% in 2025. Because the rate is so high, this small branch is the largest single source of unknown-origin volume in 2023 and 2024, at 38% and 40% of the year’s total.
The other large source is the statistical allocation, branch 6.1,
which fails for the opposite reason: a low rate on a very large branch.
It leaves 1.2 Mt unresolved in 2023 — 2% of its own volume, and 26% of
all the unknown-origin volume in the year. In 2024 it is 1.5 Mt at 3%.
In those two years it fails to land on a municipality at about the same
rate as a direct silo match (branch 2.1).
2025 is different. Branch 6.1 leaves 2.7 Mt unresolved — 5% of its
own volume, and 40% of all the unknown-origin volume in the year,
overtaking branch 2.2 as the largest source. That is the most useful
thing in this section: the rise in the national unknown-origin share in
2025 comes mostly from the allocation step resolving less, not from more
volume reaching it.
| Year | Branch | Unknown-origin volume (t) | Branch volume (t) | Unknown (%) |
|---|---|---|---|---|
| 2023 | 2.2. LINK TO SILO CADASTRO ONLY | 1,770,000 | 1,900,000 | 93.2 |
| 2023 | 6.1 ALLOCATE LH TO SILO USING MDIC AND KNOWN SOURCE PATTERN | 1,200,000 | 48,700,000 | 2.5 |
| 2023 | 2.3. LINK TO SILO SICASQ ONLY | 1,120,000 | 2,520,000 | 44.3 |
| 2023 | 2.1. LINK TO SILO LIST AND CADASTRO | 499,000 | 18,100,000 | 2.8 |
| 2023 | 1.1 LINK TO FARM MUNICIPALITY WITH PRODUCTION | 95,700 | 5,960,000 | 1.6 |
| 2023 | UNKNOWN - MISSING INFORMATION | 977 | 653,000 | 0.1 |
| 2024 | 2.2. LINK TO SILO CADASTRO ONLY | 1,960,000 | 1,990,000 | 98.8 |
| 2024 | 6.1 ALLOCATE LH TO SILO USING MDIC AND KNOWN SOURCE PATTERN | 1,470,000 | 50,900,000 | 2.9 |
| 2024 | 2.3. LINK TO SILO SICASQ ONLY | 1,200,000 | 2,270,000 | 53.0 |
| 2024 | 1.1 LINK TO FARM MUNICIPALITY WITH PRODUCTION | 59,600 | 5,720,000 | 1.0 |
| 2024 | 3.1.1 LINK TO CRUSH WITH SILO | 50,400 | 2,840,000 | 1.8 |
| 2024 | 2.1. LINK TO SILO LIST AND CADASTRO | 35,600 | 17,100,000 | 0.2 |
| 2024 | UNKNOWN - MISSING INFORMATION | 32,700 | 628,000 | 5.2 |
| 2024 | 6.2 ALLOCATE LH TO SILO USING MDIC AND KNOWN SOURCE PATTERN | 21,000 | 12,000,000 | 0.2 |
| 2024 | 3.1.2.2 LINK TO CRUSH WITH >1 SILO IN SAME MUNICIPALITY | 9,650 | 3,860,000 | 0.2 |
| 2025 | 6.1 ALLOCATE LH TO SILO USING MDIC AND KNOWN SOURCE PATTERN | 2,710,000 | 59,900,000 | 4.5 |
| 2025 | 2.2. LINK TO SILO CADASTRO ONLY | 2,150,000 | 2,580,000 | 83.4 |
| 2025 | 2.3. LINK TO SILO SICASQ ONLY | 1,030,000 | 5,520,000 | 18.7 |
| 2025 | 1.1 LINK TO FARM MUNICIPALITY WITH PRODUCTION | 431,000 | 6,860,000 | 6.3 |
| 2025 | UNKNOWN - MISSING INFORMATION | 329,000 | 1,000,000 | 32.8 |
| 2025 | 2.1. LINK TO SILO LIST AND CADASTRO | 157,000 | 15,400,000 | 1.0 |
Version benchmarking (v2.6.1 vs v2.7.0)
The first level of comparison between the two models is at the decision-tree level, by comparing their harmonized branches. The two models have several key elements in common:
-
Direct linkages: Both models establish direct links based on the CNPJ-14 between the Bill of Lading (BoL) data and the CNPJ/Soy facility list.
-
Indirect linkages: For flows that cannot be directly matched to a BoL shipment, both models attempt to identify a municipality-level hub using statistical allocation methods.
-
In model v2.6.1, unmatched flows were not explicitly identified as unknowns. They were assigned to branches 2 and 3, which both start from the shipment’s MDIC state of origin and then split it across the hubs in that state — but differ in what they use to decide the split:
Branch How the hub is chosen Evidence used 2.1Hubs this exporter has historically used, matched on CNPJ-14 The exporter’s own sourcing history — “sticky” hubs 2.2The same, matched on the less specific CNPJ-8 The exporter group’s own history 2.3The closest hub in the state Distance only 3.1The average hub pattern for that port × commodity × state All exporters’ observed flows 3.2The average for that commodity × state All exporters’ observed flows 3.3The average for that state alone All exporters’ observed flows So branch 2 personalises the allocation to the exporter, and branch 3 falls back to the market-wide average, widening the match each time it fails. Branch 3 carries by far the most volume of the two.
-
In model v2.7.0, these flows are explicitly labelled “Distribution of unmatched flows”, with the corresponding 2.4 or 3.4 prefixes. (This is the taxonomy of the 2022 run compared here; the 2023–2025 runs replace those prefixes with 6.1 / 6.2, allocate logistics hub to silo using MDIC and known source pattern, for the same kind of flow.)
-
In other words, the underlying treatment of these flows is similar between the two versions — v2.7.0’s
6.1is essentially v2.6.1’s branch 3, an MDIC state plus a known sourcing pattern — but the interpretation has changed. In v2.6.1, flows for which no logistics hub could be identified were implicitly treated as lower-confidence branches. In v2.7.0, these cases are made explicit: they are identified as unmatched flows, rather than being presented as if a logistics hub had been confidently identified. -
Unknown-origin flows: This category represents the flows that remain after all available methods for identifying a municipality-level logistics hub and consequently the municipality of production, have been exhausted. These flows cannot be reliably attributed to a specific municipality of origin and therefore remain classified as unknown-origin flows.
| Linkage | v2.6.1 volume (t) | v2.7.0 volume (t) | v2.6.1 (%) | v2.7.0 (%) |
|---|---|---|---|---|
| Direct link to farm or silo | 25,100,000 | 22,200,000 | 27.0 | 23.9 |
| Direct link to crushing facility | 0 | 11,500,000 | 0.0 | 12.3 |
| Link to exporter’s office | 0 | 9,400,000 | 0.0 | 10.1 |
| Allocated from sourcing patterns | 46,600,000 | 48,800,000 | 50.0 | 52.5 |
| Unknown - missing information | 21,400,000 | 1,150,000 | 23.0 | 1.2 |
Both versions total 93.08 Mt over the same 2022 shipments, so the percentage columns are directly comparable. The movement is all in one direction: v2.6.1 leaves 23.0% of volume with nothing to go on at all, and v2.7.0 reduces that to 1.1%. Most of the released volume becomes a direct facility link or an office link, and a further 12.4% goes to crushing facilities — a category v2.6.1 does not distinguish at all.
Note that this 2022 comparison is not the same picture as the 2023–2025 runs above, where the statistical allocation is the largest single category. The 2022 file is an earlier run of the v2.7.0 pipeline, so read it as evidence about the decision tree’s design rather than about the published 2023–25 output.
Municipality of production: what moved
Two questions are worth separating here.
The first is what the model rebuild did to the sourcing map, which is answered by holding the export year fixed at 2022 and swapping only the model version. The second is what a user of the published data will actually see when the series moves from the last v2.6.1 year to the first v2.7.0 year — that is, v2.6.1 2022 against v2.7.0 2023, which mixes the rebuild with a year in which Brazil’s soy exports grew by about a quarter.
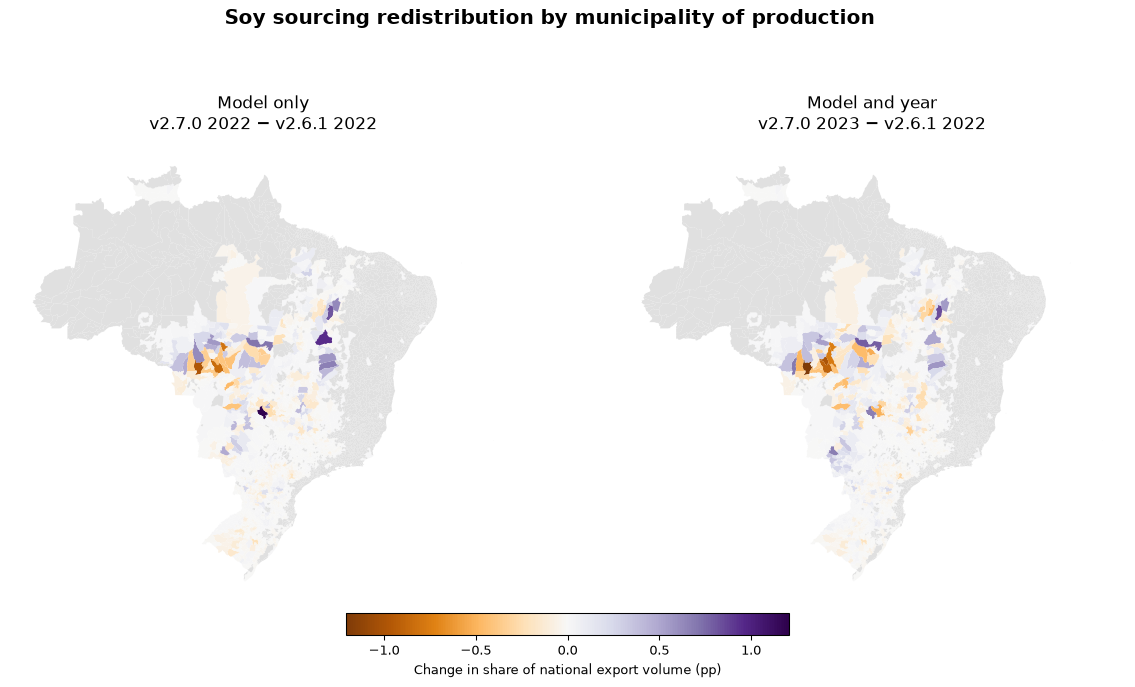
Both maps below are drawn in share of national export volume (percentage points) rather than tonnes. Tonnes would be misleading for the cross-year panel, because 2023 is a much larger year in absolute terms and almost every municipality would come out positive; shares put the two panels on the same footing, so the extra movement in the right-hand panel is the year rather than the size of the crop.
| Object | Version ID | Last modified |
|---|---|---|
s3://trase-storage/brazil/spatial/boundaries/ibge/old/boundaries municipalities/MUNICIPALITIES_BRA.geojson |
g2HnnvMTrrgDRajbw4.iwnHsgHOP1cTn | 2025-03-25 10:23:39 UTC |
| Municipality | v2.6.1 2022 (%) | v2.7.0 2022 (%) | v2.7.0 2023 (%) | Model only (pp) | Model and year (pp) |
|---|---|---|---|---|---|
| Campo Novo do Parecis | 1.66 | 0.67 | 0.45 | -0.99 | -1.21 |
| Lucas do Rio Verde | 0.99 | 0.55 | 0.00 | -0.44 | -0.99 |
| Nova Mutum | 1.50 | 0.65 | 0.59 | -0.85 | -0.90 |
| Baixa Grande do Ribeiro | 0.00 | 0.81 | 0.84 | +0.81 | +0.84 |
| São Félix do Araguaia | 0.00 | 0.72 | 0.79 | +0.72 | +0.78 |
| Sorriso | 2.77 | 2.37 | 2.00 | -0.40 | -0.77 |
| Sinop | 0.81 | 0.00 | 0.06 | -0.81 | -0.75 |
| Campos de Júlio | 0.00 | 0.49 | 0.70 | +0.49 | +0.70 |
| Jataí | 0.12 | 1.30 | 0.79 | +1.19 | +0.68 |
| Maracaju | 0.47 | 0.96 | 1.15 | +0.48 | +0.68 |
The redistribution is concentrated in the soy belt, as expected, and it is genuinely two-directional rather than a uniform lift. Holding the year fixed, v2.7 moves share into Jataí, Formosa do Rio Preto, Baixa Grande do Ribeiro, São Félix do Araguaia and out of Campo Novo do Parecis, Nova Mutum, Sinop, Campo Verde.
The second panel is not simply the first panel amplified: several municipalities that v2.7 promotes at fixed year 2022 give some of it back in 2023, and the biggest movers are not the same ones (Baixa Grande do Ribeiro, São Félix do Araguaia, Campos de Júlio, Jataí gain most over the combined step). More striking, one municipality that carried over 0.5% of national volume under v2.6.1 all but vanishes by v2.7.0 2023 — Lucas do Rio Verde. That is far more likely to be a coverage artefact than a real sourcing change, and worth chasing individually.
The coverage numbers bear that out:
| Model run | Municipalities on the map | Volume with unknown origin (%) |
|---|---|---|
| v2.6.1 2022 | 1,795 | 23.0 |
| v2.7.0 2022 | 2,098 | 4.5 |
| v2.7.0 2023 | 2,258 | 4.0 |
Holding the year fixed, v2.7.0 both maps far more volume and spreads it over more municipalities than v2.6.1 — that is the rebuild working as intended. Moving on to 2023 the municipality count is essentially unchanged, but the unknown-origin share climbs back to roughly where v2.6.1 was: the map is no narrower, it simply places much less of the year’s volume on it.
That is the important caveat on the right-hand map. It mixes a real improvement in spatial resolution with a coverage regression that all but cancels it, and should not be read as “what v2.7 did”. The left-hand panel is the one that answers that question.
The same comparison for the three largest traders, one row each. Reading across a row shows how that trader’s mapped sourcing changes when the model is rebuilt (first two columns, same year) and then when the year moves on as well (third column).
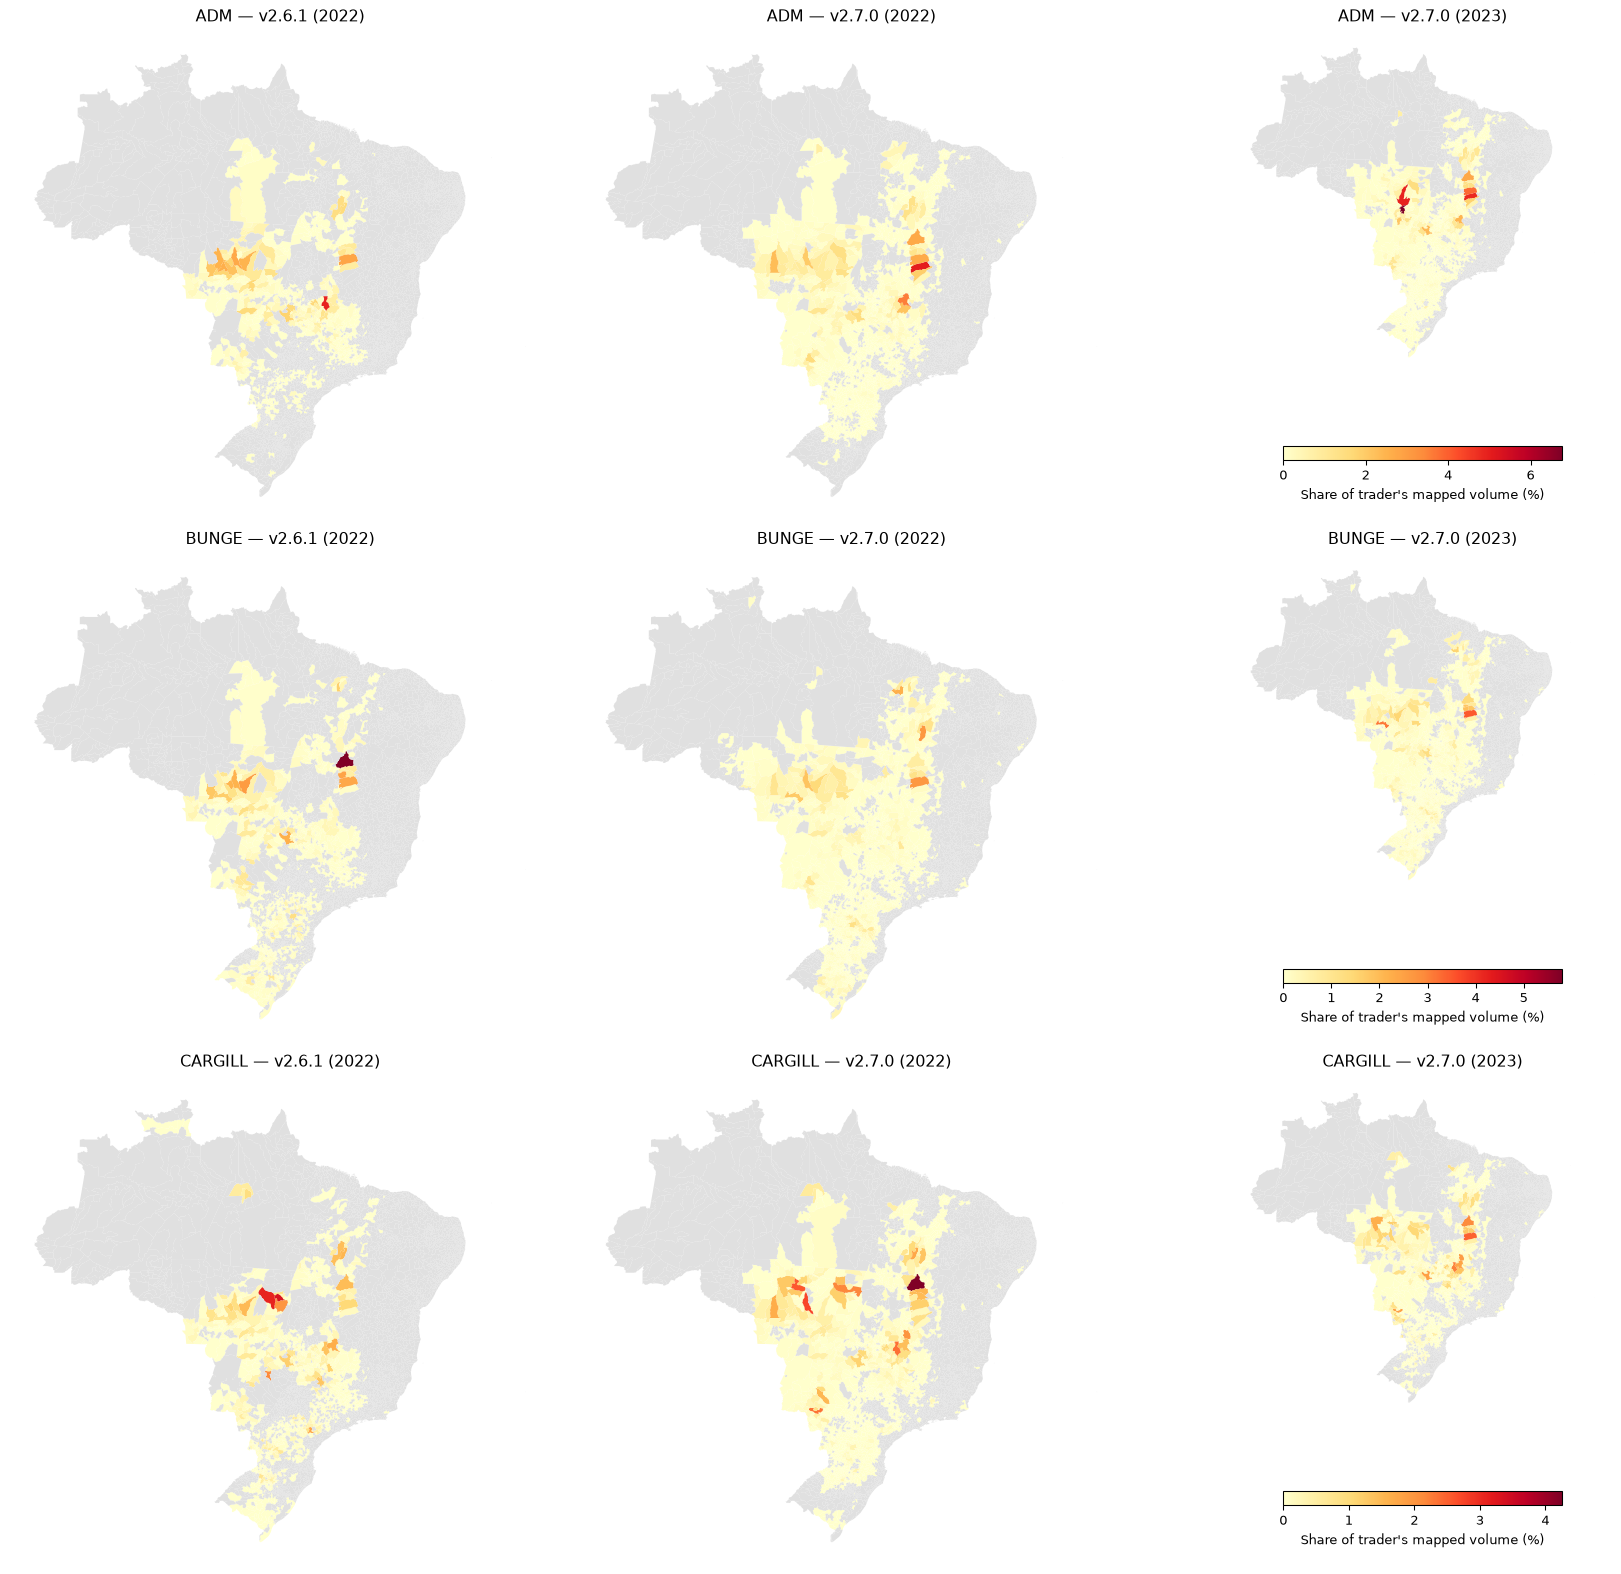
The per-trader picture matches the national one: for all three traders the middle panel covers more municipalities than the left, and the third panel is a similar spread again rather than a narrower one. What does change in 2023 is how much of each trader’s volume makes it onto the map at all.
| Trader | v2.6.1 2022 (%) | v2.7.0 2022 (%) | v2.7.0 2023 (%) |
|---|---|---|---|
| ADM | 8.9 | 0.0 | 0.2 |
| BUNGE | 25.5 | 3.6 | 8.6 |
| CARGILL | 16.0 | 5.0 | 0.1 |
Every figure is the share of that trader’s export volume left with an unknown municipality of production. The shape is the same for all three: a sharp improvement under the rebuild at fixed year — ADM goes to zero — and then a regression in 2023 that takes every one of them back to, or past, where v2.6.1 was.
So the 2023 coverage problem is not confined to a few traders. It reaches the three largest exporters alike, which points at the allocation step itself rather than at anything specific to a company’s own data.