View or edit on GitHub
This page is synchronized from trase/models/brazil/soy_2023_2024_v27/qa/decision_sao_paulo_office_hubs.md. Last modified on 2026-11-02 10:41 CET by dependabot[bot].
Please view or edit the original file there; changes should be reflected here after a midnight build (CET time),
or manually triggering it with a GitHub action (link).
Brazil soy v2.7.0 decision: São Paulo office and wholesale logistics
hubs
QA of the largest 2023 Brazil soy flow found that ADM’s 3.38 Mt
Santos-to-China shipment is assigned a logistics hub of São Paulo
municipality (BR-3550308), because the exporting CNPJ
02003402005991 is registered at an office building on Avenida Roque
Petroni Júnior in Vila Gertrudes. The proposal on the table is to add a
São Paulo-specific exception to the logistics-hub assignment logic for
office/wholesale locations, and to route the affected flows to Unknowns
to be solved instead.
This notebook sized that change before it was written, and the decision it fed into is recorded below. It answers two questions:
- How much volume would a São Paulo office/wholesale exception affect in 2023 and 2024?
- Are there other municipalities where the same artefact occurs?
It does not implement the exception and it does not re-run the supply-shed model. Everything below is measured on the released v2.7.0 model output, so the counterfactual in where would the volume go is an indication of direction and magnitude, not a model re-run.
Key takeaways
- The narrow exception — branch 4.1.1 only — affects 9.10 Mt in 2023 (7.8% of national volume) and 5.57 Mt in 2024 (4.8%). In 2023 that volume comes from just 6 exporting CNPJs, of which ADM’s São Paulo registration is the largest at 4.04 Mt.
- Branch 4.1.1 is not the only route by which São Paulo becomes a hub, and it is not the largest. São Paulo carries 22.6 Mt of logistics-hub volume in 2023 (19.4% of the national total) and 21.2 Mt in 2024. Branch 4.1.1 accounts for 40% of that in 2023 and only 26% in 2024. The rest arrives mostly through branches 2.1 (silo list and cadastro) and 1.2 (farm municipality, no production).
- Those other branches are reached by the same corporate head offices,
through secondary CNAEs. Cargill, COFCO, Louis Dreyfus, CHS and CJ
are all registered at São Paulo addresses carrying warehousing
(
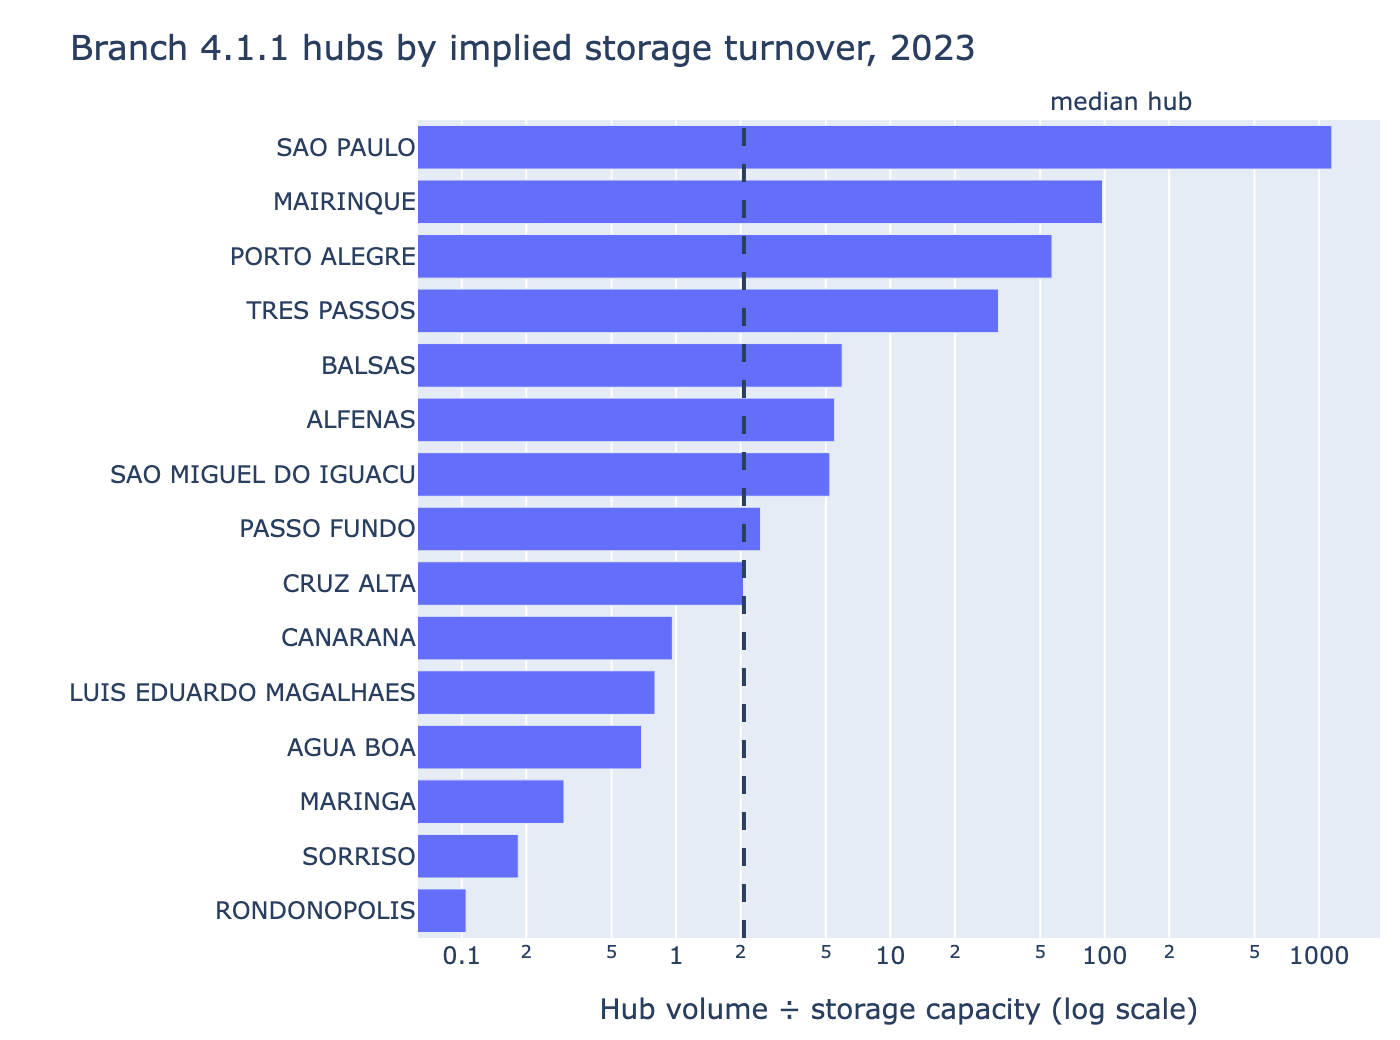
5211-7/01,5211-7/99) or post-harvest (0163-6/00) CNAEs alongside their wholesale CNAEs. Because the cadastro keeps the lowest level per CNPJ, these register as level 1 or 2 and never reach branch 4. An exception scoped to branch 4.1.1 alone would leave 11.1 Mt (2023) and 13.5 Mt (2024) of the same artefact in place — and in 2024 it would move less volume than it leaves behind. - São Paulo has essentially no soy infrastructure. The facility list gives it 7,920 t of storage (two records, one company), ABIOVE gives it no crushing capacity, and it grows no soy. Its implied storage turnover is about 2,853× a year, against a median across hub municipalities of 2.1×. The next-highest is Ruropolis at 1,232×, on a fraction of the volume.
- Yes, there are other municipalities with the same signature, but they are far smaller. The clearest are Bom Jardim (RJ) and Guarujá (SP), which have no recorded storage or crushing capacity at all, plus Porto Alegre, Mairinque and Três Passos on the looser turnover test. On the strict screen, every non-São-Paulo municipality together accounts for 1.3 Mt in 2023 against São Paulo’s 7.3 Mt. This is not a general class of problem; it is one very large instance plus a thin tail.
- Routing the branch-4.1.1 São Paulo volume to unknowns would take the unknown-routed pool from 30% to about 38% of 2023 volume before re-allocation. Spread on the existing known sourcing pattern, it moves roughly 1.3 pp of national hub volume into Mato Grosso and 1.3 pp into Paraná, with smaller gains in Bahia, Maranhão and Rio Grande do Sul.
What was decided
São Paulo, Mairinque and Porto Alegre are excluded from branch 4 by
municipality, and the flows fall through to Unknowns to be solved.
Implemented in PR
#5678; recorded
in DECISIONS.md.
The rule is a plain municipality list, with no CNAE or facility-ownership test on top. Both of the extra clauses this notebook explored were dropped, for reasons the analysis below makes visible:
- The CNAE clause is redundant inside branch 4: every row reaching
it is an office/wholesale registration by construction. Implementing
it as a cadastro lookup would in fact have been wrong — Bunge’s São
Paulo CNPJ
84046101033873does not appear inSOY_CNPJ_2023.parquetat all, and enters branch 4 through a hand-maintained level-4 row inbrazil/dictionaries/extra_cnpj_dict.csv. - The facility-ownership clause was dropped deliberately. Requiring that the exporter’s group own no storage in the municipality would have spared Bunge’s 1.82 Mt (2023) and 2.01 Mt (2024), because Bunge owns the one facility recorded in São Paulo — all 7,920 t of it, registered to a different establishment. A binary “owns something there” test lets a small shed immunise a very large flow.
Dropping those clauses makes the exception a per-municipality one, so it moves the whole of the branch-4.1.1 volume at each: 12.16 Mt in 2023 (10.5% of national) and 7.79 Mt in 2024 (6.7%) — São Paulo 9.10 / 5.57, Porto Alegre 1.70 / 2.07, Mairinque 1.37 / 0.14.
A named list was preferred over the capacity-ratio rule the turnover section suggests, on the grounds that it is easier to review and does not put a threshold into the model that we would then have to defend. The two land in nearly the same place on this data — a 100× ratio rule excludes 10.39 Mt in 2023 against 10.34 Mt for the three municipalities under the fuller screen — but on different municipalities, and the list will need revisiting as registrations move.
This is a deliberate partial fix. Scoping to branch 4 leaves the São Paulo volume that arrives through branches 2.1 and 1.2 — 10.7 Mt in 2023 and 13.2 Mt in 2024 — in place, so São Paulo remains the largest single logistics hub afterwards, at roughly 13.5 Mt (2023) and 15.6 Mt (2024) against Rondonópolis at 6.1 / 7.6 Mt. That is tracked as follow-up work rather than folded into this change; the section on branch interactions sets out why those branches are the same artefact by another route.
Datasets used
| Object | Version ID | Last modified |
|---|---|---|
s3://trase-storage/brazil/soy/sei_pcs/v2.7.0/SEI_PCS_BRAZIL_SOY_2023_TMP_1000.parquet |
O.b9r3UowlQXtz6OPHuwm54MDShP7y00 | 2026-08-18 13:28:06 UTC |
s3://trase-storage/brazil/soy/sei_pcs/v2.7.0/SEI_PCS_BRAZIL_SOY_2024_TMP_1000.parquet |
iuqA9PnZj0Df.FcHrrN7h7F6KH2_0m1t | 2026-08-17 13:21:01 UTC |
s3://trase-storage/brazil/soy/auxiliary/cnpj/SOY_CNPJ_2023.parquet |
Pi4.lD.O.2L8X1nLMWy.2hZPINfMNlL8 | 2026-06-18 14:41:33 UTC |
s3://trase-storage/brazil/logistics/silos/silo_map_v3/silos_consolidated_capacity_brazil_2024_2.geojson |
AJ4O1a_WTMQr87PG4rU18SSofyI7BGf4 | 2026-08-03 15:31:48 UTC |
s3://trase-storage/brazil/logistics/abiove/out/CRUSHING_FACILITIES_2003_2024.csv |
A7pEPC97Fnx5ai3kroyKwOUjEkFm5xUh | 2026-08-09 15:47:27 UTC |
s3://trase-storage/brazil/dictionaries/municipality.csv |
z_B6MGioQpUwqxF4sCsm0hPayeh2SciL | 2025-03-26 09:44:52 UTC |
SEI_PCS_BRAZIL_SOY_{year}_TMP_1000.parquet— the final SEI-PCS export file at bill-of-lading granularity, after the supply-shed solution. The field this notebook turns on islogistics_hub_trase_id(the municipality the decision tree assigned as the point of aggregation), together withbranch(the rule that assigned it).volis in tonnes, read the same way as incomparison_to_secex_exports.qmd.SOY_CNPJ_2023.parquet— the soy CNPJ cadastro, one row per CNPJ × CNAE, carrying thelevel(1 farm, 2 storage, 3 crushing, 4 office/wholesale) that decides which branch a flow takes. A single CNPJ commonly appears at several levels;preparation.pykeeps the lowest one, which is the mechanism behind the branch-interaction section.silos_consolidated_capacity_brazil_2024_2.geojson— the consolidated storage facility list, withstorage_capacity_tnand the owningcnpj. This is the same file the model reads to build its silo candidates.CRUSHING_FACILITIES_2003_2024.csv— ABIOVE crushing capacity by municipality, company and year.
São Paulo carries a fifth of all logistics-hub volume
Before scoping the exception it is worth seeing how much of the model hangs on this one municipality.
| Year | National volume (Mt) | São Paulo as hub (Mt) | Share of national | Rank among hubs |
|---|---|---|---|---|
| 2023 | 116.4 | 22.6 | 19.4% | #1 |
| 2024 | 116.7 | 21.2 | 18.2% | #1 |
São Paulo is the single largest logistics hub in the model in both years, by a wide margin. That is the context for the ADM finding: it is not an isolated record, it is the top of a very large pile.
Splitting that volume by the branch that assigned it shows that the exception’s target is one part of a bigger pattern.
2023 — São Paulo (BR-3550308) as logistics hub, by branch
| Branch | Volume (Mt) | % of national |
|---|---|---|
| 4.1.1 Office Is Not Located At A Port And Trades >20,000 T | 9.1 | 7.82% |
| 2.1. Link To Silo List And Cadastro | 6.599 | 5.67% |
| 1.2 Link To Farm Municipality No Production | 4.116 | 3.54% |
| 2.4 Distribution Of Unknowns | 1.625 | 1.40% |
| 3.2.1 Link To Crush No Silos In Municipality, Use Sicasq | 0.876 | 0.75% |
| Unknown - Missing Information | 0.176 | 0.15% |
| 3.4 Distribution Of Unknowns | 0.102 | 0.09% |
2024 — São Paulo (BR-3550308) as logistics hub, by branch
| Branch | Volume (Mt) | % of national |
|---|---|---|
| 2.1. Link To Silo List And Cadastro | 8.184 | 7.01% |
| 4.1.1 Office Is Not Located At A Port And Trades >20,000 T | 5.568 | 4.77% |
| 1.2 Link To Farm Municipality No Production | 4.987 | 4.27% |
| 2.4 Distribution Of Unknowns | 1.351 | 1.16% |
| 3.2.1 Link To Crush No Silos In Municipality, Use Sicasq | 0.694 | 0.59% |
| 3.4 Distribution Of Unknowns | 0.23 | 0.20% |
| Unknown - Missing Information | 0.181 | 0.16% |
Branch 4.1.1 — the office-that-is-not-at-a-port rule the proposed exception targets — is the largest single contributor in 2023, but in 2024 it drops behind branch 2.1. Branches 2.1 and 1.2 together carry more São Paulo volume than 4.1.1 does in both years.
São Paulo has essentially no soy infrastructure
What makes São Paulo wrong as a hub is not that it is urban; it is that the physical capacity to aggregate the volume does not exist there. This is the test that later generalises to other municipalities.
| São Paulo municipality | Value |
|---|---|
| Storage capacity (facility list) | 7,920 t across 2 records |
| Crushing capacity (ABIOVE 2024) | 0 t |
| Soy produced (model, 2023) | 0 t |
| Implied storage turnover, 2023 | 2,853× per year |
| Implied storage turnover, 2024 | 2,676× per year |
To put the turnover figure in perspective: a genuine transhipment hub cycles its storage a few times to a few dozen times a year. The distribution across every hub municipality in the model shows where São Paulo sits.
| Hub municipality (2023) | Hub volume (Mt) | Storage (t) | Turnover |
|---|---|---|---|
| SAO PAULO | 22.59 | 7,920 | 2,853× |
| RUROPOLIS | 1.87 | 1,520 | 1,232× |
| CUIABA | 1.76 | 2,816 | 626× |
| ITAITUBA | 2.72 | 10,300 | 264× |
| PARAGUACU PAULISTA | 2.69 | 21,870 | 123× |
| PORTO ALEGRE | 3.42 | 29,900 | 115× |
| MAIRINQUE | 1.41 | 13,970 | 101× |
| TRES PASSOS | 0.64 | 14,079 | 46× |
Across the 75 hub municipalities that have both recorded storage and more than 50 kt of assigned volume, the median turnover is 2.1× and the 95th percentile is 123×. São Paulo’s 2,853× is 1,376 times the median.
Question 1: how much volume would the exception affect?
The answer depends on how the exception is scoped. Three scopes are worth costing, because they are the three defensible readings of “São Paulo office/wholesale locations”.
| Scope | 2023 (Mt) | 2023 % | 2024 (Mt) | 2024 % |
|---|---|---|---|---|
| A — branch 4.1.1 only (as ticketed) | 9.1 | 7.8% | 5.57 | 4.8% |
| B — office/wholesale CNPJ, any branch | 20.19 | 17.4% | 19.08 | 16.3% |
| C — all São Paulo hub volume | 22.59 | 19.4% | 21.2 | 18.2% |
The headline answer to question 1 is scope A: 9.10 Mt in 2023 and 5.57 Mt in 2024.
The volume is concentrated in a handful of registrations, which makes the change easy to review and easy to regression-test.
2023 — branch 4.1.1 into São Paulo, by exporting CNPJ
| Exporter group | CNPJ | Product | Volume (Mt) |
|---|---|---|---|
| ADM | 02003402005991 |
SOYBEANS | 4.035 |
| BUNGE | 84046101033873 |
SOYBEANS | 1.823 |
| ENGELHART | 14796754000104 |
SOYBEANS | 1.652 |
| WILMAR SUGAR BRASIL COMERCIAL LTDA. | 13009252000123 |
SOYBEANS | 0.605 |
| MARUBENI | 25142875000159 |
SOYBEANS | 0.539 |
| OLAM BRASIL LTDA | 03902252001095 |
SOYBEANS | 0.446 |
2024 — branch 4.1.1 into São Paulo, by exporting CNPJ
| Exporter group | CNPJ | Product | Volume (Mt) |
|---|---|---|---|
| ADM | 02003402005991 |
SOYBEANS | 2.919 |
| BUNGE | 84046101033873 |
SOYBEANS | 2.013 |
| OLAM | 03902252001095 |
SOYBEANS | 0.316 |
| MARUBENI | 25142875000159 |
SOYBEANS | 0.202 |
| WILMAR SUGAR BRASIL COMERCIAL LTDA. | 13009252000123 |
SOYBEANS | 0.066 |
| MARUBENI | 60884756000172 |
SOYBEANS | 0.051 |
Two things stand out. The affected volume is entirely soybeans — no
cake or oil — which answers the “good to test if any of these have OIL
or CAKE here?” note in
decision_tree_description.md for
this municipality. And the set of CNPJs is not stable between years:
Engelhart contributes through branch 4.1.1 in 2023 and not at all in
2024, because the same company moves to branch 2.1. That instability is
itself an argument for scoping the exception on the CNPJ rather than on
the branch.
The ADM case that prompted the investigation resolves as follows.
| Year | CNPJ 02003402005991, all (Mt) | …hubbed in São Paulo (Mt) | …Santos → China (Mt) | Model rows |
|---|---|---|---|---|
| 2023 | 5.39 | 4.08 | 3.38 | 734 |
| 2024 | 3.53 | 2.96 | 2.38 | 821 |
ADM’s company group (CNPJ8 02003402) owns 33 storage facilities in
the facility list, totalling 1,520,215 t across 27 municipalities —
none of them in São Paulo. The five largest:
| Municipality | State | Capacity (t) | Facilities |
|---|---|---|---|
| RONDONOPOLIS | BR-51 | 147,290 | 1 |
| SORRISO | BR-51 | 130,600 | 2 |
| NOVA MUTUM | BR-51 | 105,940 | 2 |
| PRIMAVERA DO LESTE | BR-51 | 100,820 | 2 |
| SINOP | BR-51 | 74,430 | 1 |
This is the evidence for not reassigning to the nearest company facility. The volume at stake — 4.04 Mt in 2023 — is 3× ADM’s total national storage capacity. Pushing it onto Rondonópolis, or splitting it across the 33 sites, would replace one artificial concentration with another and would need capacity and sourcing assumptions the data does not support.
A branch-4.1.1-only exception leaves most of the artefact in place
This is the interaction the ticket asks about, and it is the main finding of this notebook.
São Paulo is reached as a logistics hub through branches 1.2 and 2.1 as well as 4.1.1. The question is whether those are different cases — real farms and silos that happen to sit in São Paulo — or the same case arriving by another route. Listing the CNAEs held by the CNPJs concerned settles it.
Branch 2.1 — link to silo list and cadastro, into São Paulo, 2023
| Exporter group | CNPJ | Volume (Mt) | Levels held | CNAEs held |
|---|---|---|---|---|
| CARGILL | 60498706000157 |
3.489 | 2, 3, 4 | 1042200, 4623108, 4623199, 4632001, 5211799 |
| COFCO | 06315338000119 |
2.529 | 2, 4 | 4622200, 4623108, 4623199, 4632001, 4632002, 5211701, 5211799 |
| NOVAAGRI INFRA-ESTRUTURA DE ARMA | 09077252000193 |
0.558 | 2, 4 | 4622200, 4623199, 4632001, 4632002, 5211701 |
| GRANOL | 50290329000102 |
0.023 | 2, 3 | 1041400, 5211799 |
| KUEHNE+NAGEL SERVICOS LOGISTICOS | 02886427000164 |
0 | 2 | 5211799 |
Branch 1.2 — link to farm municipality, no production, into São Paulo, 2023
| Exporter group | CNPJ | Volume (Mt) | Levels held | CNAEs held |
|---|---|---|---|---|
| LOUIS DREYFUS | 47067525000108 |
2.187 | 1, 2, 3, 4 | 0163600, 1041400, 4622200, 4623108, 4632001, 5211701, 5211799 |
| CJ INTERNATIONAL BRASIL COMERCIA | 21294708000172 |
0.943 | 1, 4 | 0163600, 4622200, 4623199, 4632001 |
| CHS | 05492968000104 |
0.794 | 1, 2, 4 | 0163600, 4622200, 4623199, 4632001, 5211701, 5211799 |
| AGRINVEST BRASIL | 07634590000153 |
0.07 | 1, 2, 4 | 0115600, 0163600, 4622200, 4623199, 4632001, 5211799 |
| AGRINVEST BRASIL | 07634590001630 |
0.069 | 1 | 0115600 |
| NUTRADE COMERCIAL EXPORTADORA LT | 52733714000102 |
0.052 | 1, 4 | 0163600, 4622200, 4623199, 4632001 |
The CNPJs carrying essentially all of this volume — Cargill, COFCO and
NovaAgri on branch 2.1, Louis Dreyfus, CJ and CHS on branch 1.2 — all
hold an office/wholesale CNAE (4622-2/00, 4623-1/xx, 4632-0/0x).
They are the same kind of São Paulo corporate registration as ADM’s.
They avoid branch 4 only because they also carry a warehousing CNAE
(5211-7/01, 5211-7/99) or the post-harvest code 0163-6/00, and
preparation.py keeps the lowest level per CNPJ:
# some CNPJs have multiple tax municipalities: pick lowest level or random one
df = df.sort_values("level").groupby(["cnpj"]).head(1).reset_index()
The tail of each table is genuinely different — Granol and Kuehne+Nagel hold no office/wholesale CNAE at all, and one Agrinvest registration holds only the soy-cultivation code — but between them they account for well under 1% of the volume. The pattern holds where the volume is.
0163-6/00 is worth singling out. The model’s own SOY_CNAE map
carries a comment warning that it is “not entirely conclusive … we’ve
found evidence of it being used in places that are definitely not
logistics hubs or farms”. It is exactly what puts Louis Dreyfus’s and
CHS’s São Paulo head offices into branch 1.
There is a second mechanism behind branch 2.1. That branch requires the CNPJ’s tax municipality to contain a silo — belonging to anyone.
| CNPJ | Company | Capacity (t) |
|---|---|---|
84046101037194 |
(not in the soy cadastro) | 6,300 |
84046101037194 |
(not in the soy cadastro) | 1,620 |
So 7,920 t of storage registered to a single company is enough to qualify São Paulo as a silo municipality for every exporter registered there — which is how Cargill’s and COFCO’s São Paulo offices become branch 2.1 hubs carrying 6.6 Mt in 2023 and 8.2 Mt in 2024.
The cost of scoping the exception to branch 4.1.1 alone is therefore:
| Year | Caught by the branch 4.1.1 rule (Mt) | Caught by the CNPJ-based rule (Mt) | Missed by the branch rule (Mt) | …as % of national |
|---|---|---|---|---|
| 2023 | 9.1 | 20.19 | 11.09 | 9.5% |
| 2024 | 5.57 | 19.08 | 13.51 | 11.6% |
In 2024 a branch-4.1.1 exception would move less volume than it leaves behind. Whichever scope is chosen, the choice should be deliberate and recorded in the decision log, rather than an accident of which function the carve-out was written into.
Note also that branch 1.1 never assigns São Paulo: 1.1 requires the farm municipality to produce soy, and São Paulo produces none, so these flows fall to 1.2 by construction. Branch 4.1.2 (office at a port) also never assigns São Paulo, because São Paulo is not in the port municipality list. Those two branches are safe; 1.2 and 2.1 are not.
Where would the volume go?
Routing the flows to Unknowns to be solved hands them to the existing
unknown-sourcing allocation (branches 2.4/3.4, “distribution of
unknowns”), which spreads volume according to the known sourcing
pattern. The size of the pool they would join:
| Year | Already allocated as unknown (Mt) | Left unknown (Mt) | Added by scope A (Mt) | Unknown-routed share after |
|---|---|---|---|---|
| 2023 | 34.8 (29.9%) | 0.5 (0.5%) | 9.1 | 38.2% |
| 2024 | 43.2 (37.0%) | 0.5 (0.5%) | 5.6 | 42.3% |
Applying the model’s own known, non-São-Paulo hub pattern to the scope-A volume indicates where it would land. This approximates the allocation step rather than reproducing it: the real allocation works from MDIC state patterns and respects the supply-shed structure.
2023 — indicative shift in logistics-hub state shares
| Hub state | Before (Mt) | After (Mt) | Change |
|---|---|---|---|
| São Paulo | 29.3 | 21 | -7.12 pp |
| Mato Grosso | 20.5 | 22.1 | +1.30 pp |
| Paraná | 14.8 | 16.3 | +1.29 pp |
| Bahia | 8.8 | 9.8 | +0.87 pp |
| Maranhão | 7.3 | 8.2 | +0.81 pp |
| Rio Grande do Sul | 10.2 | 11.1 | +0.80 pp |
2024 — indicative shift in logistics-hub state shares
| Hub state | Before (Mt) | After (Mt) | Change |
|---|---|---|---|
| São Paulo | 27.2 | 22.1 | -4.38 pp |
| Mato Grosso | 20.8 | 21.7 | +0.82 pp |
| Paraná | 15 | 15.9 | +0.77 pp |
| Rio Grande do Sul | 12.2 | 12.9 | +0.64 pp |
| Pará | 7.7 | 8.3 | +0.54 pp |
| Maranhão | 7.8 | 8.4 | +0.52 pp |
The direction is what the QA would predict: volume leaves São Paulo state and reappears in the producing and transhipment states — Mato Grosso, Paraná, Rio Grande do Sul, Bahia, Maranhão — which is a more plausible geography for the physical soy than an office in Vila Gertrudes.
Question 2: are there other municipalities like this?
The São Paulo signature has three parts: the hub is assigned from an office/wholesale registration; the exporter’s group owns no storage or crushing capacity in that municipality; and the municipality has little or no soy activity of its own. Applying that screen to every branch-4.1.1 hub assignment finds the comparable cases.
| Year | All branch 4.1.1 (Mt) | No company facility in hub (Mt) | Hub has no facility at all (Mt) | No company facility & no production (Mt) |
|---|---|---|---|---|
| 2023 | 24.05 | 20.4 | 1.29 | 8.57 |
| 2024 | 19.16 | 15.88 | 0.19 | 3.75 |
The middle column is deliberately broad: a trader routinely aggregates through a municipality where a competitor owns the silos, so “no company facility” on its own is weak evidence. The strictest column — no company facility and the municipality grows no soy — is the São Paulo signature. The municipalities it flags:
2023 — hub municipalities matching the São Paulo signature
| Municipality | State | Volume (Mt) | Storage (t) | Crushing (t) | Exporter groups |
|---|---|---|---|---|---|
| SAO PAULO | BR-35 | 7.277 | 7,920 | 0 | 5 |
| BOM JARDIM | BR-33 | 0.726 | 0 | 0 | 1 |
| GUARUJA | BR-35 | 0.351 | 0 | 0 | 1 |
| NOVA VENECIA | BR-32 | 0.151 | 0 | 0 | 1 |
| VITORIA DA CONQUISTA | BR-29 | 0.065 | 0 | 0 | 1 |
2024 — hub municipalities matching the São Paulo signature
| Municipality | State | Volume (Mt) | Storage (t) | Crushing (t) | Exporter groups |
|---|---|---|---|---|---|
| SAO PAULO | BR-35 | 3.555 | 7,920 | 0 | 4 |
| GUARUJA | BR-35 | 0.191 | 0 | 0 | 1 |
São Paulo’s row here (7.28 Mt in 2023) is smaller than its full branch-4.1.1 volume, because Bunge — which owns the one storage facility recorded in São Paulo — passes the company-facility test and drops out. That is the screen working as intended: Bunge has something physical there, even if only 7,920 t of it.
São Paulo still dominates the list in both years. The others are worth a look but are an order of magnitude smaller:
- Bom Jardim (RJ) and Guarujá (SP) have no recorded storage or crushing capacity at all and grow no soy. Bom Jardim carrying 0.73 Mt of Cargill volume in 2023 is the clearest non-São-Paulo instance of the same artefact. Guarujá is a more interesting case than it looks: it is part of the Santos port complex, so the flow is arguably at a port — but Guarujá is not in the model’s port municipality list, so it falls to 4.1.1 rather than 4.1.2. That is a gap in the port list, not the São Paulo problem.
- Nova Venécia (ES) and Vitória da Conquista (BA) are the same shape at much smaller volumes.
Municipalities that do produce soy are excluded from that table, but some of them still show implausible throughput. Ranking every 4.1.1 hub by storage turnover picks these up.
2023 — branch 4.1.1 hubs by storage turnover (>100 kt only)
| Municipality | State | 4.1.1 volume (Mt) | Storage (t) | Turnover | Grows soy |
|---|---|---|---|---|---|
| SAO PAULO | BR-35 | 9.1 | 7,920 | 1,149× | no |
| MAIRINQUE | BR-35 | 1.366 | 13,970 | 98× | yes |
| PORTO ALEGRE | BR-43 | 1.699 | 29,900 | 57× | yes |
| TRES PASSOS | BR-43 | 0.45 | 14,079 | 32× | yes |
| BALSAS | BR-21 | 2.915 | 489,214 | 6× | yes |
| ALFENAS | BR-31 | 0.241 | 43,870 | 5× | yes |
| SAO MIGUEL DO IGUACU | BR-41 | 0.648 | 124,110 | 5× | yes |
| PASSO FUNDO | BR-43 | 1.657 | 667,880 | 2× | yes |
| CRUZ ALTA | BR-43 | 1.056 | 511,299 | 2× | yes |
| CANARANA | BR-51 | 0.914 | 951,290 | 1× | yes |
2024 — branch 4.1.1 hubs by storage turnover (>100 kt only)
| Municipality | State | 4.1.1 volume (Mt) | Storage (t) | Turnover | Grows soy |
|---|---|---|---|---|---|
| SAO PAULO | BR-35 | 5.568 | 7,920 | 703× | no |
| PORTO ALEGRE | BR-43 | 2.074 | 29,900 | 69× | yes |
| TRES PASSOS | BR-43 | 0.704 | 14,079 | 50× | yes |
| MAIRINQUE | BR-35 | 0.143 | 13,970 | 10× | yes |
| BALSAS | BR-21 | 1.933 | 489,214 | 4× | yes |
| SAO MIGUEL DO IGUACU | BR-41 | 0.417 | 124,110 | 3× | yes |
| PASSO FUNDO | BR-43 | 2.135 | 667,880 | 3× | yes |
| SANTANA DO ARAGUAIA | BR-15 | 1.104 | 355,760 | 3× | yes |
| CURITIBA | BR-41 | 0.203 | 83,340 | 2× | yes |
| CRUZ ALTA | BR-43 | 0.772 | 511,299 | 2× | yes |
Porto Alegre and Mairinque are the two to look at next. Porto Alegre is a state capital with 29,900 t of recorded storage carrying 1.7–2.1 Mt of branch-4.1.1 volume, nearly all of it COFCO’s — the same office-registration pattern, an order of magnitude smaller than São Paulo but well outside anything the storage data supports. Mairinque (SP) is an inland São Paulo municipality with 13,970 t of storage carrying 1.37 Mt of Cargill volume in 2023, and Três Passos (RS) shows the same shape for ADM. None of these is close to São Paulo’s scale, and none needs to block the São Paulo change — but if the exception is written as a general rule rather than a hard-coded municipality, these are the cases that would come with it.
Caveats
- The counterfactual is not a model re-run. The state-shift table redistributes the affected volume on the model’s own known hub pattern. The real change would route the flows through the unknown-sourcing allocation, which uses MDIC state patterns and interacts with the supply-shed LP — including the starved-silo rule, which relaxes the distance cutoff for high-demand destinations. Removing São Paulo’s very large demand will itself change how far the model reaches for supply elsewhere. Only a re-run gives the true numbers.
- The facility list is a floor, not a census.
silos_consolidated_capacity_brazil_2024_2.geojsonis built partly from satellite interpretation and Google Places, and itsstorage_capacity_tnis frequentlyESTIMATED. A municipality showing zero capacity may have storage the list has not captured. This matters most for the smaller municipalities in the screen above; it does not plausibly explain São Paulo’s turnover. - Crushing capacity is taken from ABIOVE’s 2024 rows for both model years, so a plant that opened or closed between the two is treated as present in both.
- The cadastro is the 2023 file for both years, because
Cnpj.keycaps the year at 2023. Registrations that changed during 2024 are not reflected. - The CNAE evidence is itself suspect. As the QA note records, ADM’s
São Paulo registration carries
4623-1/99, which IBGE defines to exclude soy; the expected code would be4622-2/00. The branch assignment is being driven by CNAEs that registrants do not reliably maintain — which is a further reason to prefer routing to unknowns over inferring a specific facility. volis read as tonnes of product, consistently withcomparison_to_secex_exports.qmd. Shares of the national total are unaffected by that reading.