View or edit on GitHub
This page is synchronized from trase/products/analysis/notebooks/qa/brazil_soy_2023_24/bol_mdic_matching_check.md. Last modified on 2026-09-20 13:50 CEST by Nicolas Martin.
Please view or edit the original file there; changes should be reflected here after a midnight build (CET time),
or manually triggering it with a GitHub action (link).
Brazil soy: matching Bills of Lading to MDIC/SECEX on region & port
group
This notebook is a data-quality check of the two custom fields we added to both the Brazil Bill-of-Lading (BOL) dataset and the MDIC/SECEX customs export dataset so that the two can be matched:
mdic_bol_region_of_destination— the destination country mapped to a broad world region.mdic_bol_port_group— the export port mapped to a named port group / complex.
Both columns are derived from a single shared, hard-coded crosswalk,
trase/data/brazil/trade/mdic_bol_matching.py,
so the two datasets use identical labels and can be joined directly.
This notebook summarises what the columns contain and quantifies how
well BOL and MDIC agree on the distribution of soybean export volume
across each dimension.
Motivation for introducing regions and port groups
Both sources already record a destination country and an export port — but they define these differently, so matching on the raw fields is unreliable:
- Country of destination. BOL records the documented shipment destination — which may be a port of discharge, the consignee’s country, or an intermediate transshipment hub — whereas MDIC records the customs-declared destination. Grouping destinations into broad world regions absorbs most of this transshipment / consignee noise.
- Export port / customs unit. BOL records the maritime port of
export (from Datamar), whereas MDIC records the customs unit (URF)
that cleared the goods — a different concept that often carries a
different name for the same physical complex (e.g. BOL’s
BARCARENAvs MDIC’sBELEM). Grouping both into named port complexes harmonises these.
mdic_bol_region_of_destination and mdic_bol_port_group are the
resulting harmonised, lower-cardinality columns. The section How well
do BOL and MDIC match? quantifies how
much matching on them improves over matching on the raw country and
port.
Datasets
| Object | Version ID | Last modified |
|---|---|---|
s3://trase-storage/brazil/trade/bol/2023/gold/brazil_bol_2023_gold.parquet |
ACfJ9lqXsWG3zBOm2upDcpKsfpaemv6R | 2026-06-29 19:23:07 UTC |
s3://trase-storage/brazil/trade/mdic/port/brazil_mdic_port_2023.parquet |
E39iN8kUCDr.ewQdq1yT8Zurt_VyG91J | 2026-06-29 19:23:20 UTC |
- BOL is the cleaned “gold” Bill-of-Lading dataset. Each row is a
maritime export shipment. Volume is
net_weight_tonnes— the product weight of the merchandise as shipped (not soybean-equivalent). - MDIC/SECEX is the processed port-level customs export dataset.
Volume is
vol(KG_LIQUIDO, net kilograms of product), which we divide by 1000 to get tonnes.
Filtering to a like-for-like soybean slice
We restrict to soybeans (HS4 1201; cake and oil are excluded). We
filter BOL to that HS4, then filter MDIC to whichever HS6 codes
appear in the BOL soybean slice, and to maritime trade only
(via = "01") — because BOL only covers maritime shipments.
The two sources report similar but not identical totals for this slice — they are independent measurements, so we do not expect them to agree exactly. The agreement metrics further down are deliberately insensitive to this absolute-volume gap.
| Value | |
|---|---|
| BOL soybean total (t) | 94,396,388 |
| MDIC soybean total (t) | 99,906,130 |
| BOL / MDIC ratio | 0.945 |
The two sources label soybeans with different HS6 codes
A finding worth flagging: the two sources use different HS6
nomenclatures for soybeans. The BOL (Datamar) data still uses the
pre-2022 code 120100, whereas MDIC 2023 uses the HS2022 code 120190.
Filtering MDIC by BOL’s HS6 set works here only because the BOL data
also carries a handful of 120190 rows, so 120190 is in the set. The
tables below show the product-tonne split by HS6 in each source.
| HS6 | BOL (t) | MDIC (t) |
|---|---|---|
| 120100 | 94,305,741 | 0 |
| 120190 | 90,578 | 99,905,935 |
| 120110 | 69 | 195 |
What the two columns contain
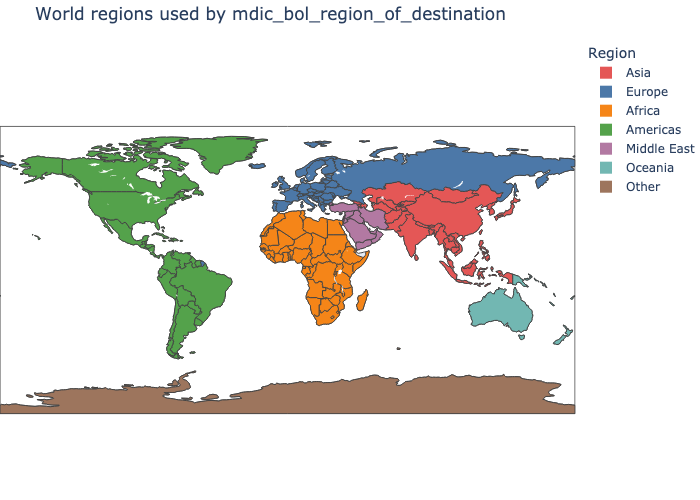
Region of destination
mdic_bol_region_of_destination groups the destination country into a
broad world region. Here is the soybean product volume in each region,
from each source, with each source’s share of its own total.
| Region | BOL (t) | MDIC (t) | BOL % | MDIC % |
|---|---|---|---|---|
| Asia | 76,157,591 | 81,635,503 | 80.7 | 81.7 |
| Europe | 8,232,184 | 7,409,718 | 8.7 | 7.4 |
| Middle East | 4,279,699 | 4,976,104 | 4.5 | 5.0 |
| Americas | 3,935,487 | 4,490,932 | 4.2 | 4.5 |
| Africa | 1,494,528 | 1,393,873 | 1.6 | 1.4 |
| Oceania | 32,999 | 0 | 0.0 | 0.0 |
| Unknown | 263,900 | 0 | 0.3 | 0.0 |
Port group
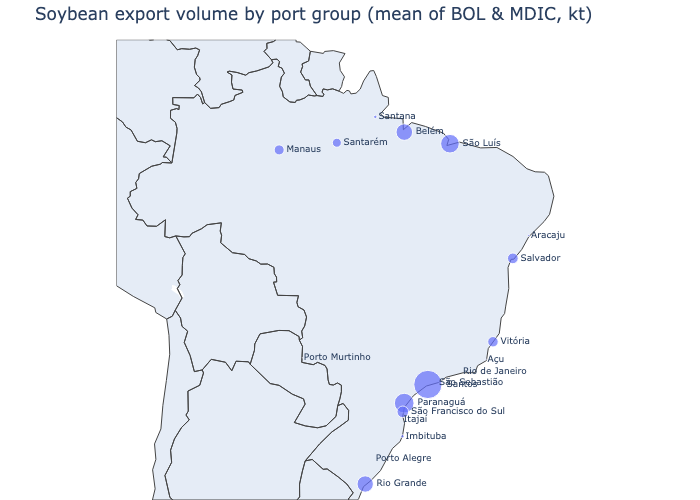
mdic_bol_port_group groups the export port into a named port complex.
On the BOL side it is keyed on the port-of-export name; on the MDIC side
on the customs unit (URF). A few groups deliberately unify the different
spellings the two sources use for the same physical complex — most
notably Belém (the BOL data calls it BARCARENA, MDIC calls it
BELEM) and Açu (BOL PORTO ACU, MDIC
IRF CAMPOS DOS GOYTACAZES).
| Port group | BOL (t) | MDIC (t) | BOL % | MDIC % |
|---|---|---|---|---|
| Santos | 28,110,515 | 30,560,637 | 29.8 | 30.6 |
| Paranaguá | 14,173,875 | 14,314,237 | 15.0 | 14.3 |
| São Luís | 12,514,720 | 12,921,919 | 13.3 | 12.9 |
| Rio Grande | 9,200,251 | 10,467,891 | 9.7 | 10.5 |
| Belém | 9,858,110 | 10,285,218 | 10.4 | 10.3 |
| São Francisco do Sul | 4,845,958 | 5,031,110 | 5.1 | 5.0 |
| Salvador | 4,248,341 | 4,166,081 | 4.5 | 4.2 |
| Vitória | 3,933,145 | 4,130,754 | 4.2 | 4.1 |
| Manaus | 3,361,884 | 4,020,480 | 3.6 | 4.0 |
| Santarém | 3,002,335 | 2,999,501 | 3.2 | 3.0 |
| Santana | 439,108 | 408,227 | 0.5 | 0.4 |
| Imbituba | 524,480 | 307,616 | 0.6 | 0.3 |
| Aracaju | 156,098 | 161,098 | 0.2 | 0.2 |
| Açu | 27,500 | 97,937 | 0.0 | 0.1 |
| Porto Murtinho | 0 | 33,423 | 0.0 | 0.0 |
| Rio de Janeiro | 0 | 0 | 0.0 | 0.0 |
| Porto Alegre | 0 | 0 | 0.0 | 0.0 |
| São Sebastião | 69 | 0 | 0.0 | 0.0 |
| Itajaí | 0 | 0 | 0.0 | 0.0 |
How well do BOL and MDIC match?
We measure agreement as the histogram intersection of the two volume-share distributions. For a set of buckets (e.g. each region), let $p_i$ be BOL’s share of its own total soybean volume in bucket $i$ and $q_i$ be MDIC’s. Then
$$\text{agreement} = \sum_i \min(p_i, q_i).$$
This is the share of volume that both sources place in the same bucket; its complement is the share that would have to be reallocated to make the two distributions identical. It is scale-free: even though absolute totals differ by about 6% (BOL 94.4 Mt vs MDIC 99.9 Mt), the agreement metric is deliberately insensitive to this.
Grouping improves the match
The point of the two new columns is that matching on them is more robust than matching on the raw destination country or export port. The table below reports the agreement — and the number of buckets — when we match on each raw field versus its grouped counterpart.
| Match on | Buckets | Agreement (%) |
|---|---|---|
| Destination country (raw) | 65 | 87.6 |
| → Region of destination (grouped) | 7 | 98.2 |
| Export port (raw) | 21 | 87.8 |
| → Port group (harmonised) | 19 | 97.9 |
Both grouped columns lift agreement by roughly ten percentage points.
For country, the gain comes from collapsing the ~65 destination
countries — which the two sources often disagree on because of
transshipment and consignee conventions — into a handful of regions. For
port, the gain is almost entirely from harmonisation rather than
fewer buckets (the count barely changes): the raw names differ for the
same physical complex (BOL BARCARENA ↔ MDIC BELEM; BOL PORTO ACU ↔
MDIC IRF CAMPOS DOS GOYTACAZES), and the port group unifies them.
Matched jointly on region × port group, agreement is 96.7%
— almost as high as either grouped dimension alone, so the residual disagreements in region and in port group are largely independent of one another rather than compounding.
How much did grouping collapse the categories?
Grouping reduces cardinality, but the raw unique count treats a dominant destination and a negligible one alike — collapsing ten tiny ports into one is very different from merging two large ones. So we also report an effective count: the Hill number of order 2 (inverse Simpson index, $1 / \sum_i p_i^2$), which weights each value by its share of volume and gives the effective number of equally-sized categories. It only falls materially when volume-bearing categories are merged. We report both, on each dataset, for each mapping.
| Dataset | Mapping | Unique (raw) | Unique (grouped) | Effective (raw) | Effective (grouped) |
|---|---|---|---|---|---|
| BOL | Country → region | 53 | 7 | 2.2 | 1.5 |
| BOL | Port → port group | 16 | 15 | 6.4 | 6.3 |
| MDIC | Country → region | 56 | 6 | 1.8 | 1.5 |
| MDIC | Port → port group | 19 | 19 | 6.2 | 6.2 |
The contrast is the point. Country → region slashes the unique count
(BOL 53 → 7) yet the effective count barely moves (≈2.2 → 1.5):
soybean exports are so concentrated on a handful of destinations (China
above all) that the dozens of countries folded away carried almost no
volume. Port → port group moves neither count much — its value is
harmonisation (relabelling BOL’s BARCARENA as BELEM so it lines
up with MDIC), not the consolidation of large ports. In short, the
unique count overstates how much the region grouping “loses”, while the
effective count shows the real, volume-weighted change is small — which
is exactly why the grouped columns match so well without discarding
meaningful resolution.
Where the small differences are
The dumbbell charts below show each source’s share of soybean volume per bucket, so the totals gap is removed and only the distribution is compared. A perfectly matched bucket has its two dots on top of one another.
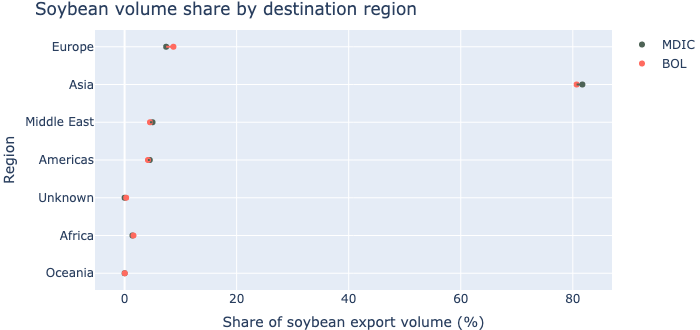
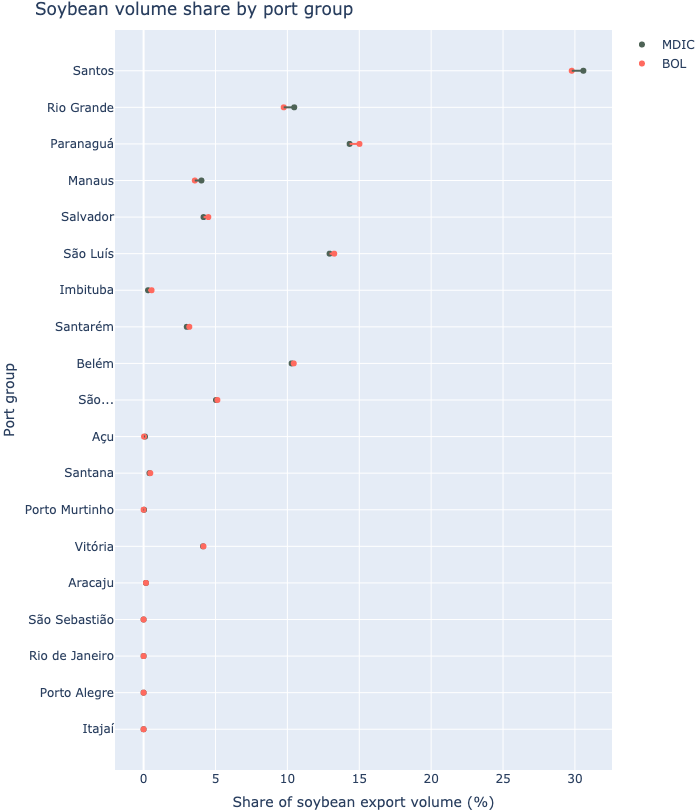
Takeaways
- The two custom columns line up very well: BOL and MDIC agree on roughly 98% of soybean volume by destination region and 98% by port group, on identical labels and with no crosswalk needed at read time.
- This is a clear improvement over matching on the raw fields (88% on destination country, 88% on export port) — grouping absorbs the differing country concepts and harmonises the differing port/customs-unit names, which is exactly why the columns were added.
- Watch the HS6 nomenclature difference (BOL
120100vs MDIC120190): the soybean slice only lines up because we filter MDIC by the BOL HS6 set and BOL happens to carry both codes. If the BOL source ever drops its120190rows, this filter would silently exclude the bulk of MDIC soybeans.
Appendix: the full mappings
For reference, the complete crosswalks from
trase/data/brazil/trade/mdic_bol_matching.py.
Note these are the entire mappings (all commodities and destinations),
not just the soybean slice used above.
Country → region
Every destination country (by Trase id / ISO 3166-1 alpha-2) mapped to its world region.
| Region | # countries | Countries |
|---|---|---|
| Africa | 56 | Algeria, Angola, Benin, Burkina Faso, Burundi, Cabo Verde, Cameroon, Central African Republic (the), Chad, Comoros (the), Congo (the Democratic Republic of the), Congo (the), Côte d’Ivoire, Djibouti, Egypt, Equatorial Guinea, Eritrea, Eswatini, Ethiopia, Gabon, Gambia (the), Ghana, Guinea, Guinea-Bissau, Kenya, Liberia, Libya, Madagascar, Malawi, Mali, Mauritania, Mauritius, Mayotte, Morocco, Mozambique, Namibia, Niger (the), Nigeria, Rwanda, Réunion, Saint Helena, Ascension and Tristan da Cunha, Sao Tome and Principe, Senegal, Seychelles, Sierra Leone, Somalia, South Africa, South Sudan, Sudan (the), Tanzania, United Republic of, Togo, Tunisia, Uganda, Western Sahara, Zambia, Zimbabwe |
| Americas | 54 | Anguilla, Antigua and Barbuda, Argentina, Aruba, Bahamas (the), Barbados, Belize, Bermuda, Bolivia (Plurinational State of), Bonaire, Sint Eustatius and Saba, Brazil, Canada, Cayman Islands (the), Chile, Colombia, Costa Rica, Cuba, Curaçao, Dominica, Dominican Republic (the), Ecuador, El Salvador, Falkland Islands (the) [Malvinas], French Guiana, Greenland, Grenada, Guadeloupe, Guatemala, Guyana, Haiti, Honduras, Jamaica, Martinique, Mexico, Montserrat, Nicaragua, Panama, Paraguay, Peru, Puerto Rico, Saint Barthélemy, Saint Kitts and Nevis, Saint Lucia, Saint Martin (French part), Saint Vincent and the Grenadines, Sint Maarten (Dutch part), Suriname, Trinidad and Tobago, Turks and Caicos Islands (the), United States of America (the), Uruguay, Venezuela (Bolivarian Republic of), Virgin Islands (British), Virgin Islands (U.S.) |
| Europe | 45 | Albania, Austria, Belarus, Belgium, Bosnia and Herzegovina, Bulgaria, Croatia, Cyprus, Czechia, Denmark, EU, Estonia, Faroe Islands (the), Finland, France, Germany, Gibraltar, Greece, Hungary, Iceland, Ireland, Isle of Man, Italy, Latvia, Lithuania, Luxembourg, Malta, Moldova (the Republic of), Monaco, Montenegro, Netherlands (the), Norway, Poland, Portugal, Republic of North Macedonia, Romania, Russian Federation (the), Serbia, Slovakia, Slovenia, Spain, Sweden, Switzerland, Ukraine, United Kingdom of Great Britain and Northern Ireland (the) |
| Asia | 35 | Afghanistan, Armenia, Azerbaijan, Bangladesh, Bhutan, Brunei Darussalam, Cambodia, China, Georgia, Hong Kong, India, Indonesia, Japan, Kazakhstan, Korea (the Democratic People’s Republic of), Korea (the Republic of), Kyrgyzstan, Lao People’s Democratic Republic (the), Macao, Malaysia, Maldives, Mongolia, Myanmar, Nepal, Pakistan, Philippines (the), Singapore, Sri Lanka, Taiwan (Province of China), Tajikistan, Thailand, Timor-Leste, Turkmenistan, Uzbekistan, Viet Nam |
| Oceania | 24 | American Samoa, Australia, Cocos (Keeling) Islands (the), Cook Islands (the), Fiji, French Polynesia, Guam, Kiribati, Marshall Islands (the), Micronesia (Federated States of), Nauru, New Caledonia, New Zealand, Norfolk Island, Northern Mariana Islands (the), PU, Palau, Papua New Guinea, Pitcairn, Samoa, Tokelau, Tonga, Vanuatu, Wallis and Futuna |
| Middle East | 15 | Bahrain, Iran (Islamic Republic of), Iraq, Israel, Jordan, Kuwait, Lebanon, Oman, Palestine, State of, Qatar, Saudi Arabia, Syrian Arab Republic, Turkey, United Arab Emirates (the), Yemen |
| Other | 1 | French Southern Territories (the) |
| Unknown | 1 | XX |
Export port → port group
Each port group and the raw port / customs-unit names (BOL and MDIC spellings) that map into it.
| Port group | # names | Source names (BOL / MDIC spellings) |
|---|---|---|
| Aracaju | 1 | ARACAJU |
| Açu | 2 | IRF CAMPOS DOS GOYTACAZES, PORTO ACU |
| Belém | 2 | BARCARENA, BELEM |
| Cabedelo | 1 | CABEDELO |
| Corumbá | 1 | CORUMBA |
| Fortaleza | 1 | FORTALEZA |
| Imbituba | 1 | IMBITUBA |
| Itajaí | 1 | ITAJAI |
| Maceió | 1 | MACEIO |
| Manaus | 1 | MANAUS |
| Natal | 1 | NATAL |
| Niterói | 1 | NITEROI |
| Paranaguá | 2 | ANTONINA, PARANAGUA |
| Pecém | 1 | PECEM |
| Porto Alegre | 1 | PORTO ALEGRE |
| Porto Murtinho | 1 | PORTO MURTINHO |
| Porto Velho | 1 | PORTO VELHO |
| Recife | 1 | RECIFE |
| Rio Grande | 1 | RIO GRANDE |
| Rio de Janeiro | 1 | RIO DE JANEIRO |
| Salvador | 1 | SALVADOR |
| Santana | 1 | SANTANA |
| Santarém | 1 | SANTAREM |
| Santos | 1 | SANTOS |
| Suape | 1 | SUAPE |
| São Francisco do Sul | 1 | SAO FRANCISCO DO SUL |
| São Luís | 1 | SAO LUIS |
| São Sebastião | 1 | SAO SEBASTIAO |
| Vitória | 1 | VITORIA |