Supply Shed Risk Analysis
View or edit on GitHub
This page is synchronized from trase/engagement/brazil/ciff/supply_shed_risk_analysis/README.md. Last modified on 2026-10-12 18:03 CEST by Nicolas Martin.
Please view or edit the original file there; changes should be reflected here after a midnight build (CET time),
or manually triggering it with a GitHub action (link).
Trase CIFF Brazil Beef Supply Shed Risk Analysis
Static dashboard package for Netlify hosting of the CIFF supply shed work. Deploy or upload the full contents of this folder as one prefix; keep the relative folder structure unchanged.
Entry Points
index.html- landing page, methods overview, use cases and guidance links.supply_shed.html- facility supply-shed mapping dashboard.risk_exposure.html- combined supply-shed risk exposure dashboard with map selectors for deforestation and conversion exposure or pasture gross CO2e emissions exposure, OpenStreetMap/CARTO basemap tiles, facility points sized by the selected exposure index and a selected-data table for supply flows and facilities.
Main findings
This dashboard package presents Brazil beef supply-shed data for risk-based screening by downstream companies, financial institutions, civil society users and procurement teams. It combines facility locations, inferred sourcing municipalities, deforestation exposure, emissions exposure, TAC evidence and audit results.
| 1,249 slaughterhouse facilities represented |
182,231 facility-source municipality links |
212 deforestation at-risk facilities |
113 emissions at-risk facilities |
| 123 median source municipalities per facility |
9 median municipalities explaining 50% of supply-network weight |
192 / 212 at-risk facilities located in Amazonia or Cerrado municipalities |
61 / 212 at-risk facilities matched to TAC signatory evidence |
The main analytical message is that supply sheds are broad, but exposure is concentrated. The median facility sources from 123 municipalities, yet the median number of municipalities accounting for half of supply-network weight is only 9. Among SIF facilities, the median supply shed is slightly broader, at 135 source municipalities, while the median number explaining half of supplied network weight is 8. This makes the dashboard useful for prioritisation: users do not need to engage every source municipality with the same intensity.
1. Facility exposure is concentrated in a smaller at-risk group
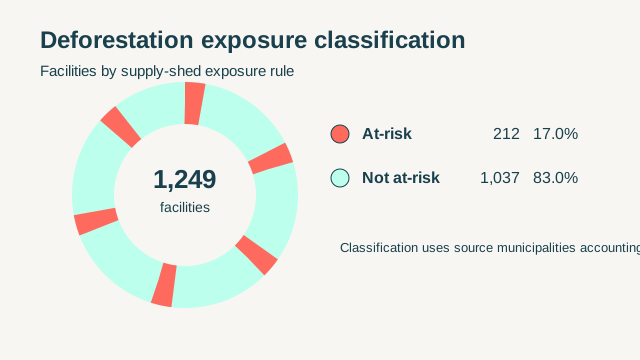
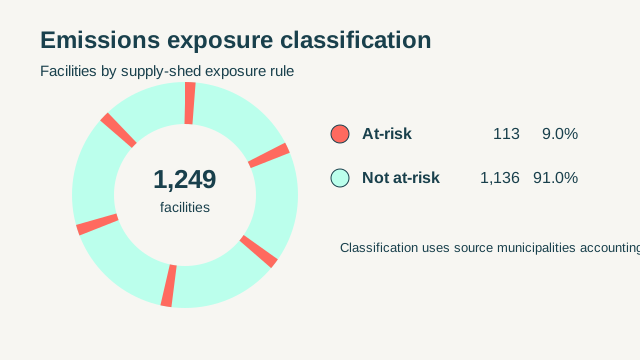
The deforestation exposure classification identifies 212 at-risk facilities out of 1,249. The emissions classification is narrower, identifying 113 at-risk facilities. These classifications are based on the stable Trase indicator parquet listed below. Source municipalities are tagged at-risk if they are part of the set accounting for the first 95% of national deforestation or emissions; facilities are tagged at-risk when at least 50% of their supply-shed flow comes from at-risk source municipalities.
2. Amazonia and Cerrado dominate the at-risk profile
| Facility location biome | At-risk facilities |
|---|---|
| Amazonia | 112 |
| Cerrado | 80 |
| Mata Atlantica | 8 |
| Pantanal | 5 |
| Caatinga | 3 |
| No biome match | 4 |
Of the 212 deforestation at-risk facilities, 192 are located in Amazonia or Cerrado municipalities. Looking at the sourcing footprint rather than facility location, 211 of the 212 at-risk facilities have at-risk source-municipality links in Amazonia and/or Cerrado. This supports using the dashboard as a biome-sensitive engagement tool: Amazonia and Cerrado should be the first screening lens, while a smaller set of Pantanal, Caatinga and other links should still be retained where exposure remains material.
At-risk deforestation exposure index is also strongly concentrated by biome:
| Source biome among at-risk source municipalities | Deforestation exposure index share |
|---|---|
| Amazonia | 82.9% |
| Cerrado | 13.7% |
| Pantanal | 3.0% |
| Caatinga | 0.5% |
| Mata Atlantica | 0.0% |
3. TAC and audit evidence should guide engagement, not replace it
| TAC status | All facilities | Deforestation at-risk facilities |
|---|---|---|
| TAC signatory | 78 | 61 |
| Not signatory | 15 | 12 |
| No TAC data matched | 1,156 | 139 |
TAC evidence is important because it shows whether facilities are part of legitimate compliance spaces. In the dashboard-matched data, 61 of the 212 deforestation at-risk facilities are matched to TAC signatory evidence. However, 139 at-risk facilities have no TAC match, and only 41 at-risk facilities have a third-party environmental audit score in the current workbook. Automated environmental audit scores are available for 20 at-risk facilities.
The TAC source table can contain multiple records for the same facility because
audit results are reported by AUDIT_CYCLE. Before merging TAC fields into the
dashboard facility tables, the preparation script keeps only the most recent
audit cycle for each CNPJ14 facility key. The root-tax/municipality fallback
lookup applies the same latest-cycle rule.
The interpretation should therefore be balanced. A TAC match should not be ignored, but it should not be treated as automatic evidence of deforestation and conversion-free sourcing. The dashboard is best used to sequence supplier engagement: facilities with no TAC or audit evidence are priority cases for requests on traceability, monitoring coverage, CAR/GTA documentation and non-compliance procedures; TAC signatories should be asked to show how those commitments apply to the specific source municipalities highlighted in their supply shed.
4. Exposure is highly concentrated among companies and facilities
The largest exposure index totals are concentrated in a small set of facility groups. For example, JBS has 39 represented facilities, of which 21 are deforestation at-risk, and accounts for about 957 deforestation exposure index points in the prepared facility table. Other high-exposure groups include Frigol and Mercurio.
| Company group | Facilities | At-risk facilities | Deforestation exposure index |
|---|---|---|---|
| JBS | 39 | 21 | 957.1 |
| Frigol | 3 | 2 | 187.1 |
| Mercurio | 2 | 1 | 184.3 |
| Ativo Alimentos Exportadora E Importadora Ltda | 1 | 1 | 138.1 |
| Vale Grande Industria E Comercio De Alimentos S/A | 4 | 3 | 108.7 |
| Frigotil - Frigorifico De Timon S/A | 1 | 0 | 107.5 |
| Frigomarca Ltda | 2 | 2 | 92.7 |
| Frigorifico Redentor S/A | 1 | 1 | 83.3 |
The same pattern appears at facility level. The eight highest deforestation exposure facilities include plants in Sao Felix do Xingu, Tucuma, Novo Progresso, Porto Velho, Santana do Araguaia, Redencao and Maraba. In several of these cases, a small number of municipalities accounts for most of the exposure: for JBS Maraba, 211 source municipalities are active in the supply shed, but 9 municipalities account for 75% of supply-network weight and 15 municipalities account for 90% of the deforestation exposure index.
5. Shared sourcing regions create system-wide engagement opportunities
At-risk source municipalities are often shared by multiple facilities. Among deforestation at-risk facilities, 320 at-risk source municipalities supply at least five at-risk facilities. This overlap matters for engagement: a downstream company may receive more consistent evidence by asking suppliers operating in the same priority municipalities to provide comparable information on monitoring coverage, supplier controls and remediation processes.
| Shared at-risk source municipality | State | Biome | Connected at-risk facilities |
|---|---|---|---|
| Caceres | Mato Grosso | Pantanal | 76 |
| Altamira | Para | Amazonia | 69 |
| Cuiaba | Mato Grosso | Cerrado | 60 |
| Santo Antonio do Leverger | Mato Grosso | Pantanal | 59 |
| Rosario Oeste | Mato Grosso | Cerrado | 59 |
Folder Structure
assets/brand/- Trase logo and landing-page imagery.assets/geo/- Brazil municipality and state geometries used by Leaflet maps.data/assets/- prepared dashboard inputs. The dashboards read only from this folder.
Prepared Dashboard Data
The asset folder contains six prepared CSVs and matching YAML metadata files:
br_beef_ciff_facilities_prepared_2024.csv- facility-level summary used by the supply-shed dashboard.br_beef_ciff_supply_shed_connections_prepared_2024.csv- source municipality connections used by the supply-shed dashboard.br_beef_ciff_deforestation_risk_facilities_prepared_2024.csv- facility-level deforestation exposure summary.br_beef_ciff_deforestation_risk_supply_shed_prepared_2024.csv- source municipality deforestation exposure rows.br_beef_ciff_emission_risk_facilities_prepared_2024.csv- facility-level emissions exposure summary.br_beef_ciff_emission_risk_supply_shed_prepared_2024.csv- source municipality emissions exposure rows.
Deforestation and emissions source-municipality values are calculated from the stable Trase indicator parquet:
s3://trase-storage/brazil/beef/indicators/gold/q4_2025/pasture_c10_beef_deforestation_emissions_2013_2023_q4_2025_multilevel.parquet
The preparation script averages the 2020-2024 values for the five-year deforestation total, five-year gross CO2e emissions total, and their respective per-tonne indicators. Source municipalities are tagged as at-risk when they are part of the set accounting for the first 95% of national deforestation or emissions; all remaining source municipalities are tagged not at-risk. Facility exposure follows the dashboard rule: a facility is at-risk when at least 50% of its supply-shed flow comes from at-risk source municipalities.
The Deforestation Exposure and Emission Exposure fields are network-scaled
screening indices rather than annual attributable hectares or CO2e totals. They
are non-negative and open-ended, not normalised to a 0-1 or 0-100 scale. The
GTA/SIG-SIF kg fields represent supply-network weight from multi-year direct,
indirect and fallback evidence. For each facility-source municipality pair, the
index combines the source municipality per-tonne indicator, the municipality's
normalised share of the facility supply shed and a supplied volume index based
on the facility's total supply-network weight relative to the median facility.
Exposure Index Equations
The exposure equations use two levels of information:
- municipality-level environmental intensity from stable Trase indicators;
- facility-source municipality supply-shed weights from GTA and SIG-SIF.
The indices are designed for screening and prioritisation. They preserve granularity between source municipalities and facility-size sensitivity between slaughterhouses, but they should not be interpreted as annual attributable hectares of deforestation or annual attributable tonnes of CO2e. Higher values indicate greater relative exposure, driven by higher source-municipality deforestation or emissions intensity, larger source shares and/or larger facility scale.
1. Source-municipality environmental indicators
For each source municipality m, the preparation script reads the Trase
indicator parquet listed above and averages the 2020-2024 values:
D_m = mean_2020_2024(CATTLE_DEFORESTATION_5_YEAR_TOTAL_m)
G_m = mean_2020_2024(CO2_GROSS_EMISSIONS_CATTLE_DEFORESTATION_5_YEAR_TOTAL_m)
ID_m = mean_2020_2024(CATTLE_DEFORESTATION_PER_TN_5_YEAR_TOTAL_m)
IG_m = mean_2020_2024(CO2_GROSS_EMISSIONS_CATTLE_DEFORESTATION_PER_TN_5_YEAR_TOTAL_m)
Where:
D_mis the cattle deforestation indicator for municipalitym;G_mis the pasture gross CO2e emissions indicator for municipalitym;ID_mis the deforestation intensity per tonne of cattle production;IG_mis the emissions intensity per tonne of cattle production.
2. Facility-source municipality supply-network weight
For each facility f and source municipality m, the prepared supply-shed row
combines GTA and SIG-SIF fallback quantities:
kg_fm = kg_per_mun_fm + quantity_sigsif_fm
prop_flow_fm = kg_fm / sum_m(kg_fm)
kg_fm is retained in the dashboards as supplied_kg_per_mun, but it should be
read as a supply-network weight. It is built from multi-year GTA records,
indirect movement links and SIG-SIF fallback evidence, so it is not treated as a
single-year slaughter volume.
The exported prop_flow is the source municipality share within each unique
facility_id. The source-municipality prop_flow values sum to 1 for each
facility supply shed.
w_fm = prop_flow_fm
Where w_fm is the share of facility f's supply shed represented by source
municipality m. The same proportional flow is used for the map indicator, the
downloaded disaggregated supply-shed table, source-level exposure indices and
facility at-risk classification.
3. Facility-size sensitivity
To retain comparability between facilities of different observed network size, the script calculates a supplied volume index:
K_f = sum_m(kg_fm) / 1000
S_f = K_f / median(K_f for facilities where K_f > 0)
Where:
K_fis the total supply-network weight for facilityf, expressed in tonnes;S_fis the supplied volume index.
This keeps larger supply-network facilities more prominent in the exposure
screening, while avoiding the claim that K_f is annual slaughter volume. The
supplied volume index is unitless: S_f = 1 represents the median positive
facility supply-network weight, values below 1 represent facilities below that
median and values above 1 represent facilities above it.
The technical supply_network_scale_index field stores the supplied volume
index and is directly proportional to the original facility-level supply-network
weight. In the prepared facility table and downloads, absolute supply-network
volume is calculated as
supplied_kg_per_mun / 1000 after summing all source-municipality rows for each
facility. Because S_f is defined as facility tonnes divided by the median
facility tonnes, facilities with twice the network weight have twice the scale
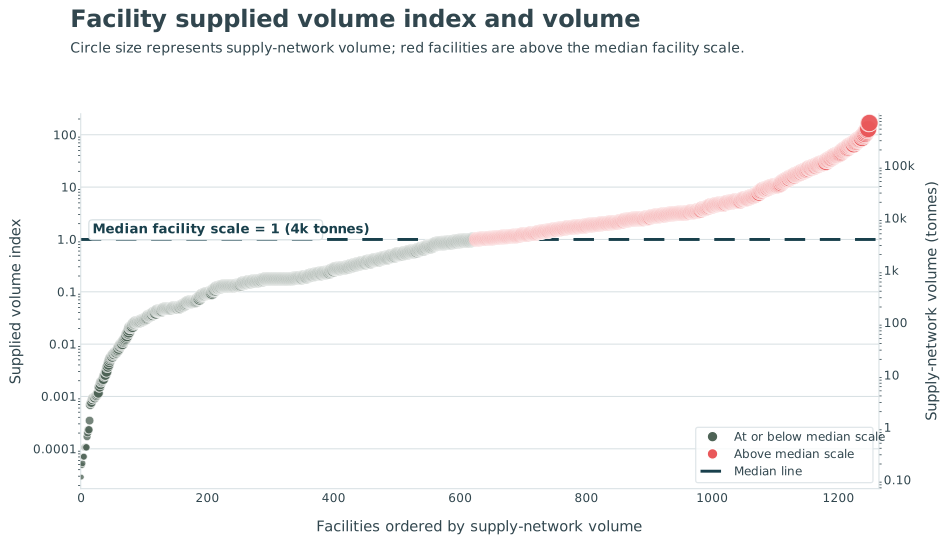
index. The chart below orders facilities by supply-network volume, plots
the supplied volume index on the left y-axis and shows the equivalent
supply-network tonnes on the right y-axis. Circle size increases with
supply-network volume, the dashed line marks the median facility supplied volume
index and red circles highlight facilities above the median.
4. Source-level exposure indices
The source-level deforestation exposure index is:
Deforestation Exposure_fm = ID_m * w_fm * S_f
The source-level emissions exposure index is:
Emission Exposure_fm = IG_m * w_fm * S_f
These are relative, network-scaled screening values. The previous experimental
calculation multiplied supplied_kg_per_mun by total_prop_flows_pct, but this
would apply the source share twice because supplied_kg_per_mun is already
municipality-attributed. The current calculation avoids that double weighting.
The resulting index values are not capped; their observed maxima depend on the
highest municipality intensity, source share and facility scale values in the
prepared data.
5. Facility-level exposure indices
Facility-level values are the sum of source-level index values across all source municipalities connected to the facility:
Deforestation Exposure_f = sum_m(Deforestation Exposure_fm)
Emission Exposure_f = sum_m(Emission Exposure_fm)
The same summed facility-level fields are used in the supply-shed dashboard
exports, the risk exposure dashboard exports and the matched-supplier downloads.
The disaggregated flow download (selected_supply_shed_connections.xlsx) also
includes supply_network_scale_index, repeated for each source-municipality row
belonging to the same facility, so users can see the facility-scale component
used in each source-level exposure calculation.
6. At-risk and not-at-risk classification
Source municipalities are classified separately for deforestation and emissions.
For each indicator, municipalities are ranked nationally from highest to lowest
indicator value. Municipalities that together account for the first 95% of the
national indicator total are tagged At-risk; all remaining municipalities are
tagged Not at-risk.
Facility exposure classification is then calculated from the facility's normalised source weights:
at_risk_share_f = sum_m(w_fm for source municipalities tagged At-risk)

if at_risk_share_f >= 0.50:
    facility exposure risk = "At-risk"
else:
    facility exposure risk = "Not at-risk"
This classification is intentionally based on supply-shed composition rather than absolute annual volume. It indicates whether a facility is structurally connected to the municipalities that dominate national cattle deforestation or cattle-deforestation emissions.
Bundled Data Checks
- Prepared supply-shed source rows: 182,231
- GTA: 62,378
- SIG-SIF fallback: 119,853
- Prepared facility rows: 1,249
- GTA: 600
- SIG-SIF fallback: 649
- SIF: 217
- SIE: 811
- SIM: 99
- CONSORCIO: 122
- Deforestation and conversion facility exposure:
- At-risk: 212
- Not at-risk: 1,037
- Deforestation and conversion supply-shed exposure rows:
- At-risk: 14,550
- Not at-risk: 167,681
- Emissions facility exposure:
- At-risk: 113
- Not at-risk: 1,136
- Emissions supply-shed exposure rows:
- At-risk: 7,557
- Not at-risk: 174,674
Runtime Dependencies
The dashboards load these browser libraries from public CDNs:
- Google Fonts: DM Sans
- Leaflet
- Chart.js
- SheetJS/xlsx
- html2canvas
For fully offline hosting, vendor these libraries locally and update the
<script> and <link> references in the HTML files.
Runtime Performance Notes
The largest runtime inputs are the risk supply-shed prepared CSVs, each about 60-63 MB. The risk exposure dashboard loads only the active risk mode at page startup and fetches the other mode only when the user switches between deforestation and emissions. Prepared CSV requests use a fixed dashboard asset version query string rather than a per-load timestamp, so browsers and static hosts can reuse cached assets while still allowing cache invalidation when the dashboard inputs are intentionally updated.
Within a browser session, parsed deforestation and emissions mode data are cached after first load. Switching back to a previously opened mode reuses the cached data instead of re-downloading and re-parsing the large CSV. The selected data table is paginated and renders only the visible page of rows, while map and export calculations continue to use the full current filter selection.
Netlify Deploy Notes
The repository root includes a netlify.toml file that points Netlify to this
static dashboard folder:
[build]
  publish = "data/brazil/beef/ciff/frontend/supply_shed_risk_analysis"
No build command is required because the dashboard is already deploy-ready static HTML, JavaScript, CSV and asset files.
S3 Upload Notes
- Upload every file and subfolder in
supply_shed_risk_analysis/. - Use
index.htmlas the default document if configuring static website hosting. - Preserve relative paths exactly; the dashboards refer to local assets under
assets/anddata/. - For S3 object metadata, use standard web content types where possible:
.html:text/html.cssif added later:text/css.js:application/javascript.csv:text/csv.geojson:application/geo+json.svg:image/svg+xml.jpg:image/jpeg- This prototype is intended for internal analysis and presentation preparation, not public release as a Trase.earth published product.