View or edit on GitHub
This page is synchronized from trase/data/brazil/logistics/silos/silo_map_v3/qa/qa_consolidated_facilities.md. Last modified on 2026-09-20 13:50 CEST by Nicolas Martin.
Please view or edit the original file there; changes should be reflected here after a midnight build (CET time),
or manually triggering it with a GitHub action (link).
Final Agricultural Facility — Consolidation Pipeline
- Overview
- 1. Final dataset at a glance
- 2. Facilities by source
- 3. Facilities by category (STORAGE vs PROCESSING)
- 4. Capacity comparison
- 5. Source representation check
- 6. State distribution
- 7. Spatial overview
Overview
This notebook details the final soy facility dataset after the process of consolidating SICARM, EOFM (AI/remote-sensing detected), ABIOVE crushing facilities, and previously validated facilities. It checks whether source datasets are represented in the final output, summarizes totals (counts and storage/processing capacity) by source and category, and flags rows that may contain personal (rather than corporate) information.
1. Final dataset at a glance
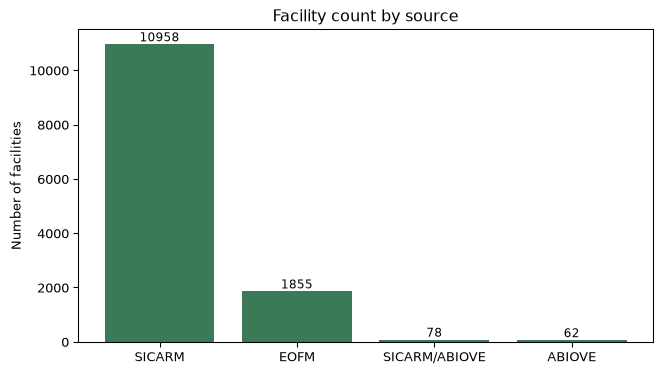
2. Facilities by source
Counts and capacity contributed by each source dataset in the final output.
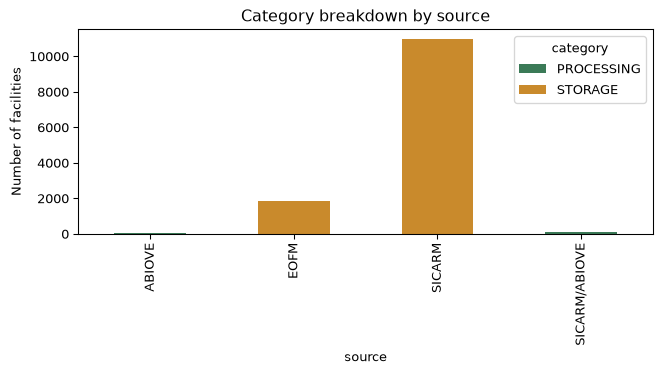
3. Facilities by category (STORAGE vs PROCESSING)
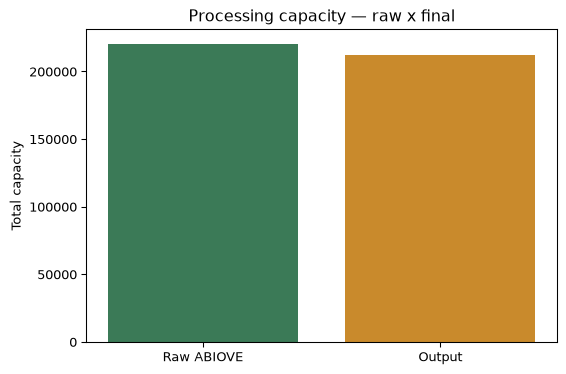
4. Capacity comparison
Total storage and processing capacity across the final dataset.
5. Source representation check
Confirms whether facilities present in the raw SICARM reference dataset are represented (by CNPJ) in the final consolidated output — a sanity check that the pipeline’s spatial/CNAE filtering and trader carve-out did not silently drop legitimate reference facilities.
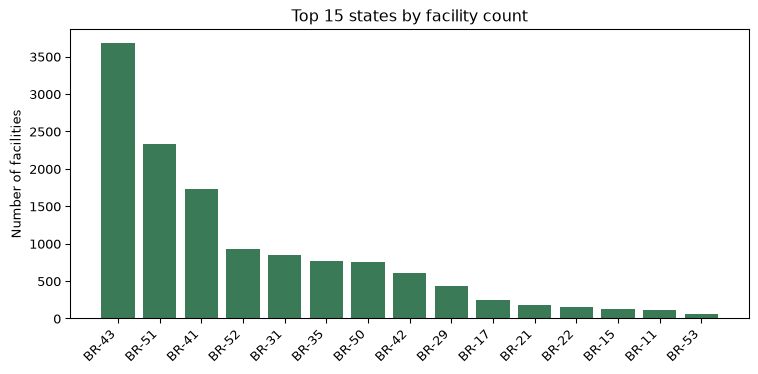
6. State distribution
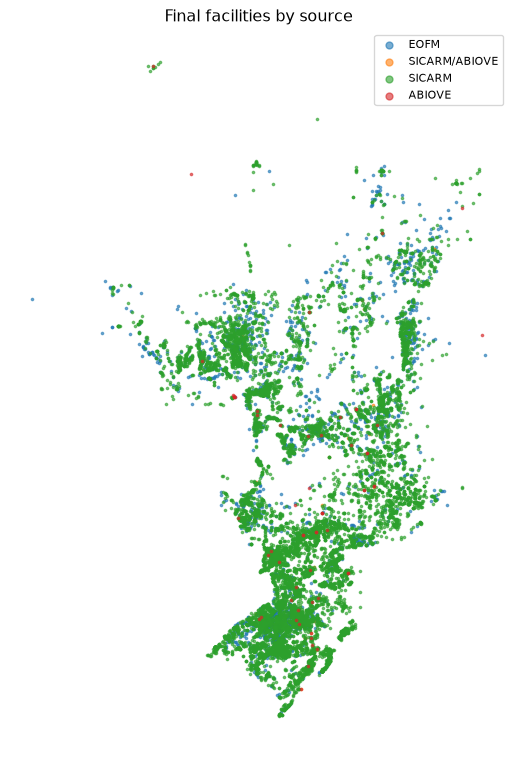
7. Spatial overview