View or edit on GitHub
This page is synchronized from trase/models/brazil/soy_2023_2024_v27/qa/supply_chain_data.md. Last modified on 2026-09-17 20:47 CEST by achandra.
Please view or edit the original file there; changes should be reflected here after a midnight build (CET time),
or manually triggering it with a GitHub action (link).
Soy Supply Chain QA
- Brazil Soy v2.7 - Quality Assurance
- Analytical Scope
- Data Consistency
- Decision Tree Results
- Municipality of Production Analysis
- Version Benchmarking (v2.6.1 vs v2.7.0)
Brazil Soy v2.7 - Quality Assurance
This notebook serves as the Quality Assurance (QA) report for the Brazil Soy v2.7 supply chain mapping model. Its primary purpose is to validate the integrity of the model’s outputs for the 2023–2024 export years and benchmark structural improvements by comparing v2.7 against its predecessor (v2.6.1) using 2022 data.
The analysis relies on the following core datasets stored in AWS S3:
- v2.7 supply chain results:
s3://trase-storage/brazil/soy/sei_pcs/v2.7.0/SEI_PCS_BRAZIL_SOY_{year}_TMP_1000.parquet - v2.6.1 supply chain results:
s3://trase-storage/brazil/soy/sei_pcs/v2.6.1/SEIPCS_BRAZIL_SOY_2022.csv - Bills of Lading (BoL):
s3://trase-storage/brazil/trade/bol/{year_str}/gold/brazil_bol_{year}_gold.parquet
Analytical Scope
This notebook evaluates the model across four key dimensions:
- Data Consistency: Validates that the end-to-end model outputs—specifically total exported soy volumes, FOB values, and top trader totals—reconcile accurately with the original baseline customs data (Bills of Lading).
- Decision Tree Diagnostics: Analyzes how soy volumes are allocated across the model’s decision tree branches. This explores how much volume is linked via direct data vs. modeled assumptions, looking at both year-over-year trends and breakdowns by top traders.
- Traceability Gaps (Unknown Origins): Tracks the volume and distribution of soy exports where the production municipality could not be identified. This section assesses how these geographical data gaps fluctuate across years, major traders, and decision-tree branches.
- Version Benchmarking (v2.6.1 vs v2.7.0): A targeted comparative analysis using 2022 data to measure shifts in decision tree logic, mapping accuracy, and municipality-level traceability across different traders and markets.
Data Consistency
Total volume
Total soy export volume and FOB values are preserved after running the model end-to-end.
Totals by top 5 exporters
Decision Tree Results
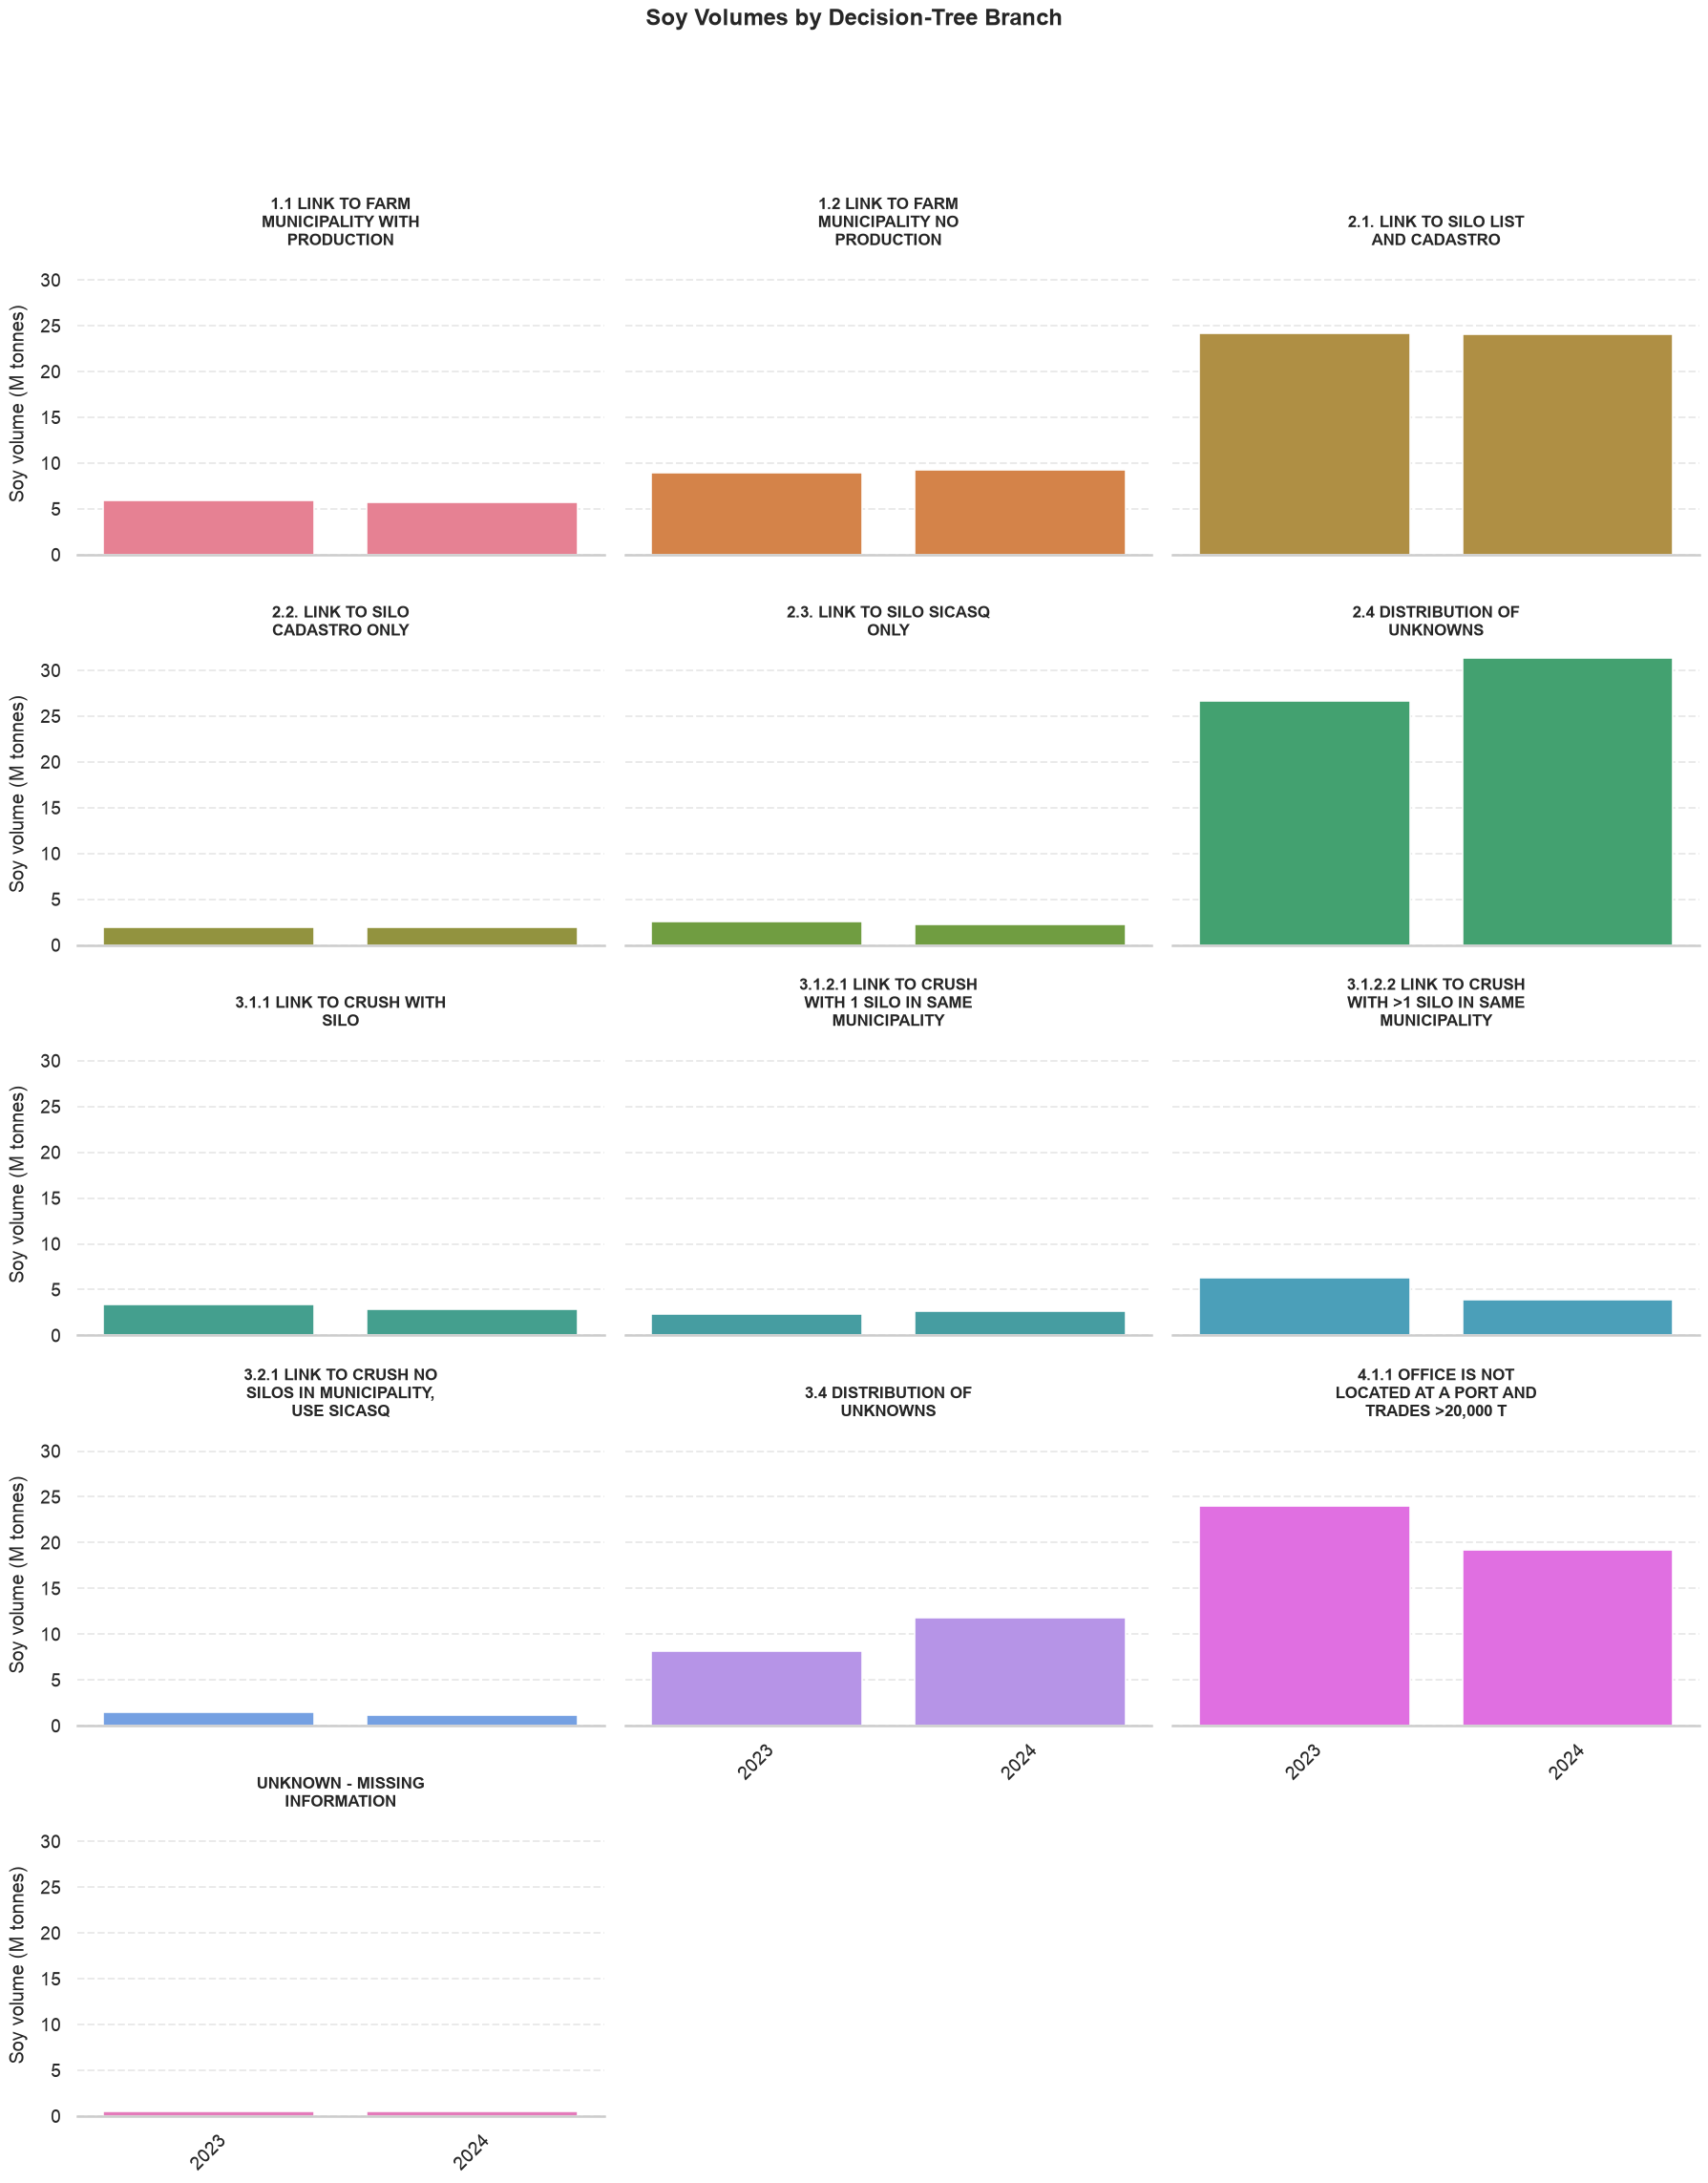
The following chart shows soy volumes by decision tree branch. The results show that > 50% of soy exports are concentrated in branches based on direct CNPJ linkages: - 1.1, 1.2 - 2.1, 2.2, 2.3 - 3.1., 3.2.
This is a significant result compared to the previous model where the rates for the same type of branches corresponded to ~30%, indicating a stronger reliance on direct data points in this updated version.
Top Traders
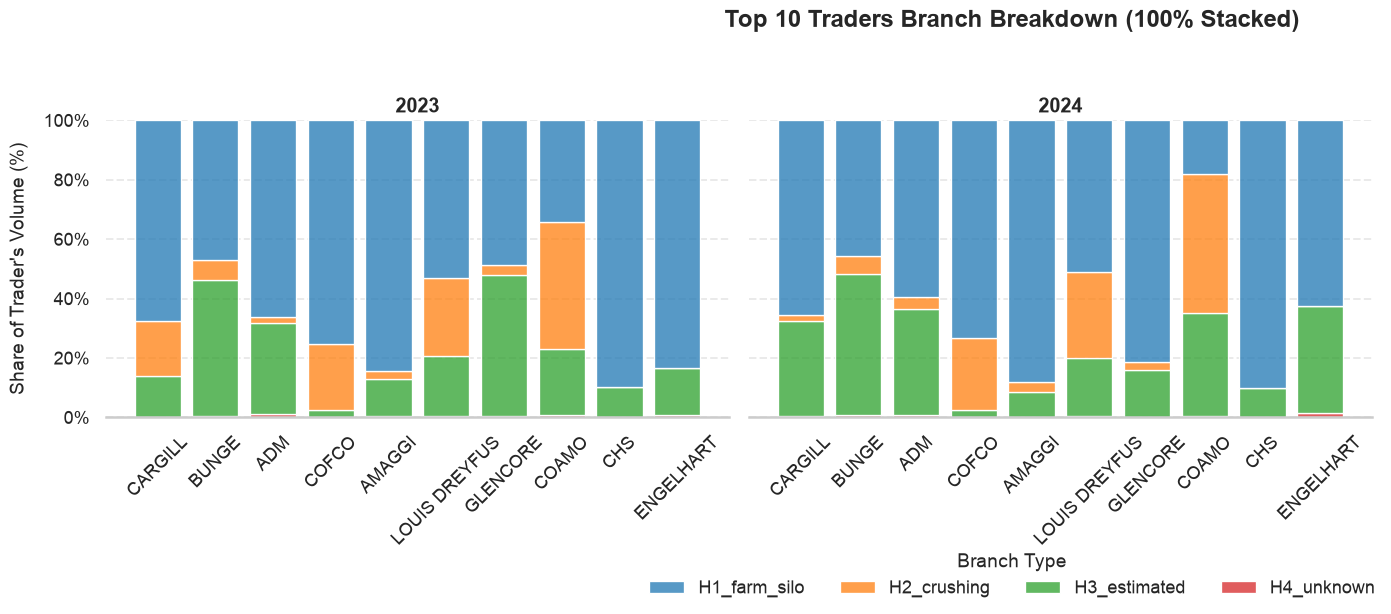
For this analysis we aggregate the branch by type of linkage data: direct links and estimated links:
| Original Branch Prefix | Aggregated Category (branch_agg) |
Linkage Type / Description |
|---|---|---|
1, 2.1, 2.2, 2.3, 4 |
H1_farm_silo | Farm and silo facilities (Direct links) |
3.1, 3.2 |
H2_crushing | Crushing facilities (Direct links) |
2.4, 3.4 |
H3_estimated | Estimated links |
5 |
H5_no_activity | No activity |
| Any other value | H4_unknown | Unknown or missing information |
Municipality of Production Analysis
This section focuses on the results of the supply shed model by checking the percent of unknown municipality of production across years, traders and branches.
Total Unknown Municipality of Production
After running the model end-to-end, only 4% of soy exports remain associated with a municipality of unknown origin. This is mainly due to the model’s distance cutoffs, which prevent it from assigning an origin when doing so would require an unfeasibly long transport distance.
To define these distance thresholds, we used CONAB’s freight dataset to estimate the average distance that commodities travel within each state.
Total Unknown Municipality of Production by Trade
Total Unknown Municipality of Production by Branch
Analyzing the breakdown by branch, it is clear that branch 2.2 had the
vast majority of its volume allocated to an unknown municipality of
origin, accounting for 94% in 2023 and 99% in 2024.
Version Benchmarking (v2.6.1 vs v2.7.0)
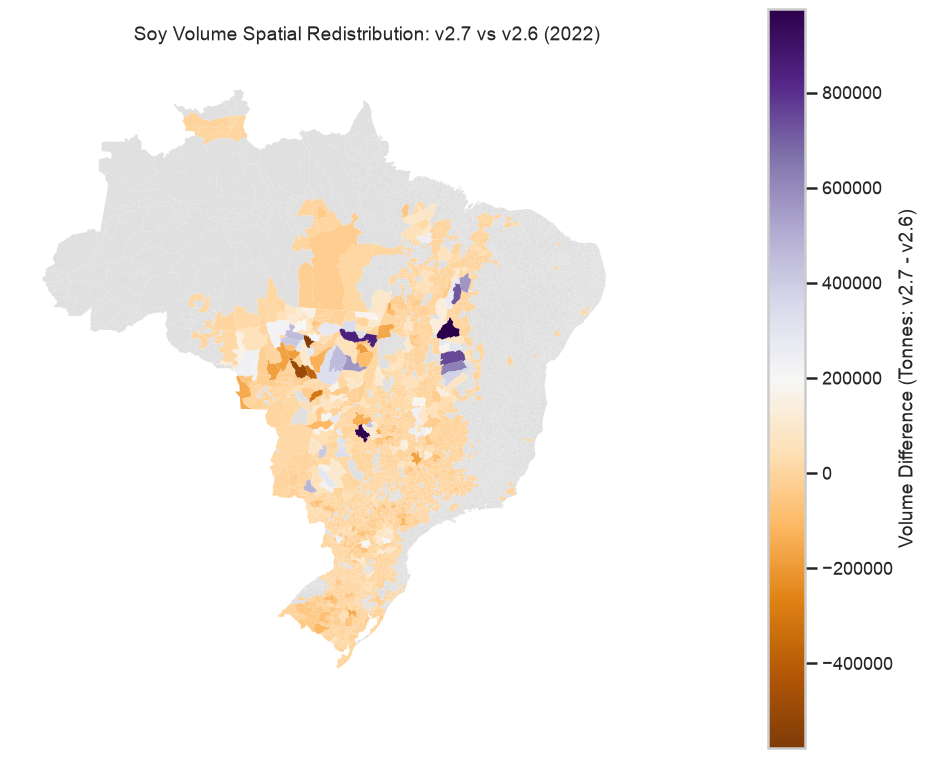
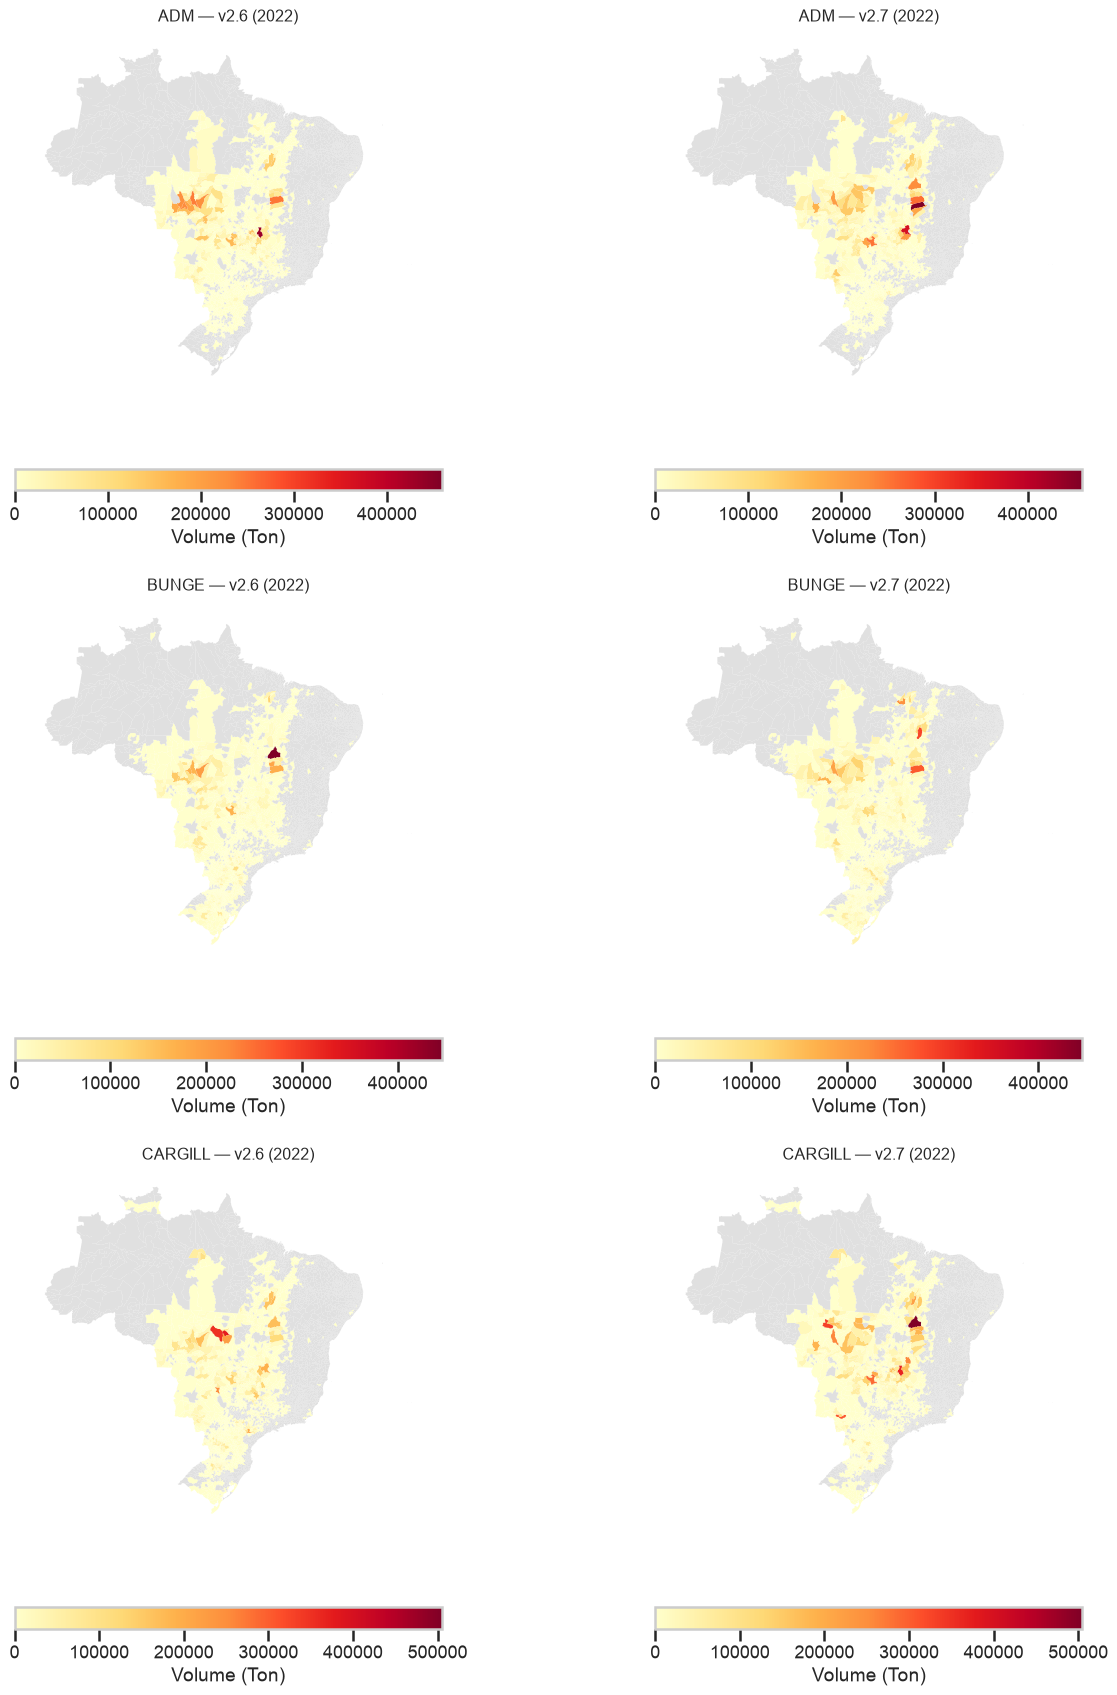
The first level of comparison between the two models is at the decision-tree level, by comparing their harmonized branches. The two models have several key elements in common:
-
Direct linkages: Both models establish direct links based on the CNPJ-14 between the Bill of Lading (BoL) data and the CNPJ/Soy facility list.
-
Indirect linkages: For flows that cannot be directly matched to a BoL shipment, both models attempt to identify a municipality-level hub using statistical allocation methods.
-
In model v2.6.1, unmatched flows were not explicitly identified as unknowns. Instead, they were assigned to Branches 2 and 3, representing lower-confidence pathways.
- In model v2.7.0, these flows are explicitly labelled “Distribution of unmatched flows”, with the corresponding 2.4 or 3.4 prefixes.
-
In other words, the underlying treatment of these flows is similar between the two versions, but the interpretation has changed. In v2.6.1, flows for which no logistics hub could be identified were implicitly treated as lower-confidence branches. In v2.7.0, these cases are made explicit: they are identified as unmatched flows, rather than being presented as if a logistics hub had been confidently identified.
-
Unknown-origin flows: This category represents the flows that remain after all available methods for identifying a municipality-level logistics hub and consequently the municipality of production, have been exhausted. These flows cannot be reliably attributed to a specific municipality of origin and therefore remain classified as unknown-origin flows.
| vol | pct_of_total | |||
|---|---|---|---|---|
| version | v2.6.1 | v2.7.0 | v2.6.1 | v2.7.0 |
| branch_harmonized | ||||
| H1_farm_silo | 25,289,332 | 48,335,113 | 27 | 52 |
| H2_crushing | 0 | 11,521,020 | 0 | 12 |
| H3_estimated | 46,918,781 | 32,212,382 | 50 | 35 |
| H4_unknown | 21,525,751 | 1,013,829 | 23 | 1 |
Municipality of Production - Differences