View or edit on GitHub
This page is synchronized from trase/models/brazil/qa_bol/SEI_PCS_compared_to_ABIEC.md. Last modified on 2026-06-20 06:32 CEST by GitHub Actions.
Please view or edit the original file there; changes should be reflected here after a midnight build (CET time),
or manually triggering it with a GitHub action (link).
ABIEC versus SEI-PCS
This notebook investigates the discrepancy in reported Brazilian beef export volumes between two major data sources: ABIEC and TRASE (SEI-PCS). The primary aim is to reproduce the volume figures from each source using a common raw data source—MDIC (Ministry of Development, Industry, and Trade)—and to understand the differences in methodology that lead to the diverging results.
The analysis highlights several key factors that contribute to these differences:
- Filtering of domestic vs. export destinations in TRACE.
- Use of volume definitions, particularly ensuring that volume_product is used instead of target_rate_equivalent_volume in TRACE.
- Variations in HS code classifications: ABIEC uses a different set of HS codes than SEI-PCS.
- NCM/HS8 filtering: ABIEC excludes non-bovine casings based on HS8-level codes, which isn't possible in TRASE due to its HS6-level source data.
By reconstructing the ABIEC and SEI-PCS outputs from the same MDIC base, this notebook mostly (but not completely) explains the differences.
Data Imports and Preprocessing
This cell sets up the core environment and reads in the datasets required for the analysis:
- ABIEC Excel File: The notebook loads an ABIEC export dataset manually extracted into Excel format. The tonnage (Tonnage) and FOB value (FOB Value) columns are converted to float and standardized for consistency.
- MDIC Data: MDIC data is loaded across a range of years, normalized (e.g., volumes are converted from kg to tonnes), and aggregated across key trade descriptors: hs4, hs6, hs8, via, and year.
- SEI-PCS Data: To avoid loading a very large parquet file, SEI-PCS data is queried directly from a PostgreSQL database. Volumes and FOB values are grouped by year and HS6 code, and domestic destinations are filtered out (country_of_destination != 'BRAZIL').
This setup provides the foundational datasets that will be aligned and compared in subsequent steps.
ABIEC HS Code Mapping and Filtering
This cell defines the HS6 codes that correspond to ABIEC’s product categories (e.g., Fresh beef, Processed, Casings). Since ABIEC does not report these codes, they have been guessed by trial-and-error.
The mapping is applied to the MDIC dataset, and a crucial filter is applied to exclude non-bovine casings (specifically 05040090) which ABIEC excludes based on HS8-level codes. Since this level of filtering is not possible in SEI-PCS, this discrepancy becomes one of the contributing factors to the data mismatch.
The output is an MDIC-derived version of ABIEC data, categorized by ABIEC’s own product labels.
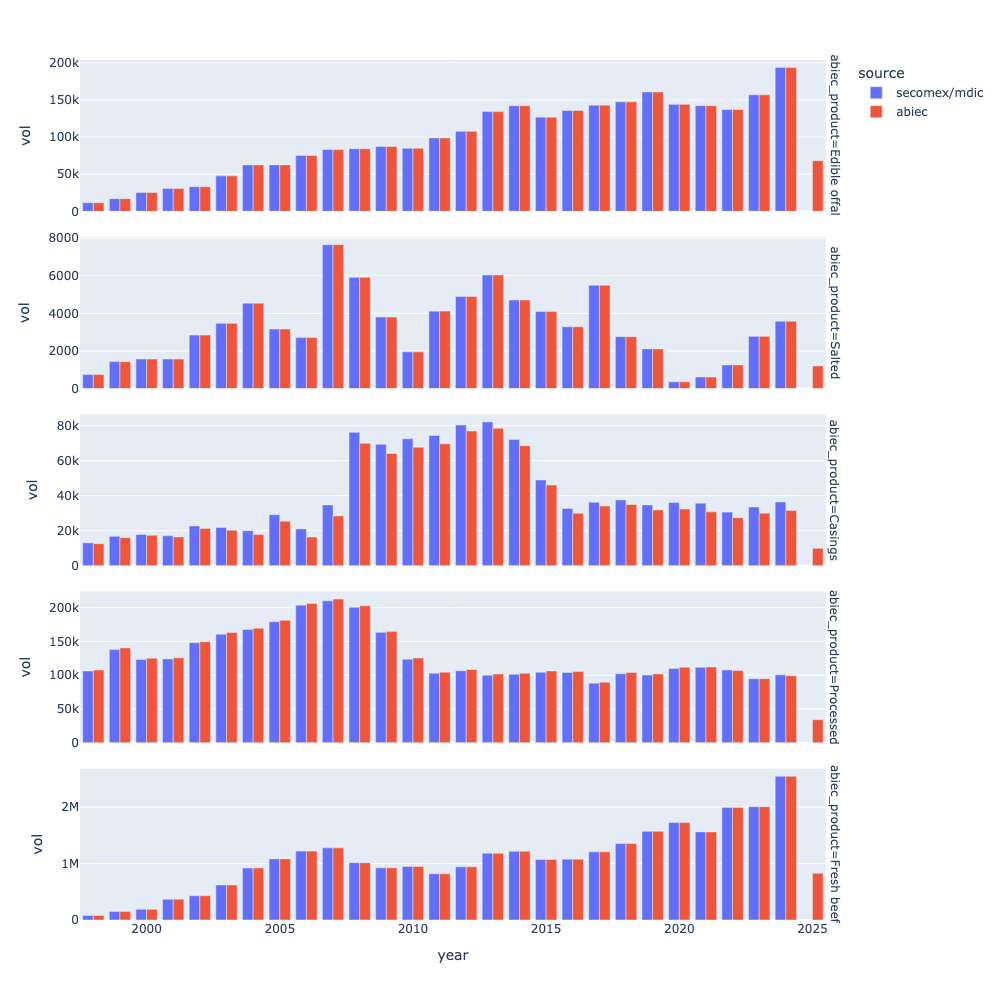
Here, a bar chart is generated to compare beef export volumes across years for each ABIEC product category, using two sources:
- Official ABIEC volumes (from the Excel file)
- Reconstructed MDIC volumes, filtered and grouped to match ABIEC’s product definitions
This visual provides a product-by-product breakdown that helps verify the mapping accuracy and assess how well the reconstructed MDIC numbers align with the official ABIEC reports.
Comparing ABIEC to SEI-PCS
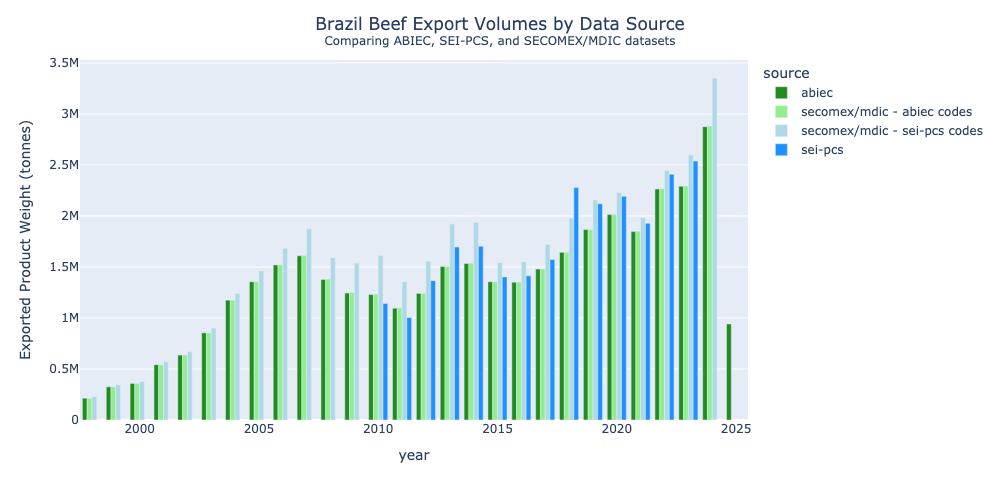
n the final cell, total export volumes are aggregated by year and data source across four categories:
- ABIEC (official numbers)
- SECOMEX/MDIC - ABIEC codes (MDIC data filtered using ABIEC’s HS codes and HS8 casing exclusion)
- SEI-PCS (TRASE data, with domestic trade excluded and volume_product used)
- SECOMEX/MDIC - SEI-PCS codes (MDIC data filtered to include only the HS6 codes used in SEI-PCS)
A grouped bar chart provides a direct comparison of annual export volumes by data source. This visualization highlights where and how each data source diverges—both in terms of absolute numbers and trends over time—offering a clearer picture of the methodological impacts on reported export volumes.
HS6-Level Drivers of the ABIEC–SEI-PCS Gap
Having reconstructed the ABIEC and SEI-PCS datasets from the same MDIC source, we can now pinpoint which HS6 codes account for the bulk of their differences. This comparison uses MDIC data filtered in two ways:
- MDIC (ABIEC codes): Applying ABIEC’s HS6 set (with the HS8 non-bovine casing exclusion).
- MDIC (SEI-PCS codes): Applying SEI-PCS’s HS6 set.
As shown in the earlier bar chart, these MDIC-derived series closely track the official ABIEC and SEI-PCS numbers, allowing us to isolate the effect of HS6 coverage.
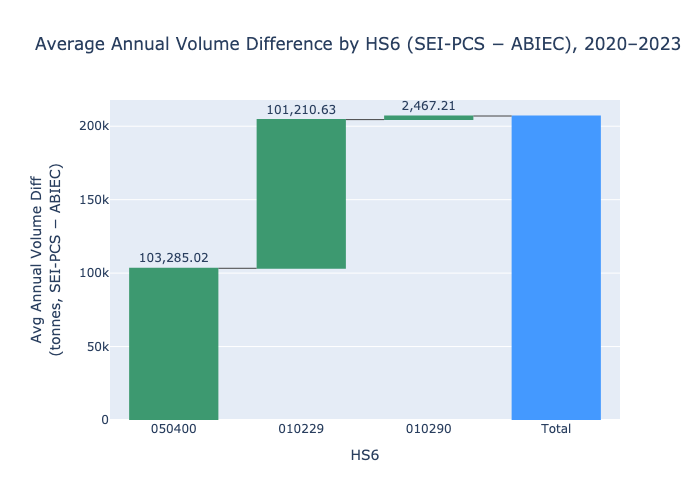
The results show that:
- SEI-PCS reports a consistently larger average annual total volume than ABIEC (by roughly 200 kt/year over 2020–2023).
- Most of this difference comes from just two HS6 codes included in SEI-PCS but absent from ABIEC’s definition:
- 050400 – Guts, bladders and stomachs of animals (other than fish)
- 010229 – Live cattle, other than pure-bred breeding animals
- A smaller contribution also comes from:
- 010290 – Live bovine animals, other than pure-bred breeding animals
That is, SEI-PCS is including these HS6-level codes and I think ABIEC isn’t (though this is based on educated guesses about ABIEC’s code usage).
Average annual total volume, 2020–2023 (sum over 4 years ÷ 4)
- ABIEC: 2,100,000 tonnes
- SEI-PCS: 2,300,000 tonnes
SEI-PCS average annual total volume is larger than ABIEC.
Could Trase be including non-bovine casings?
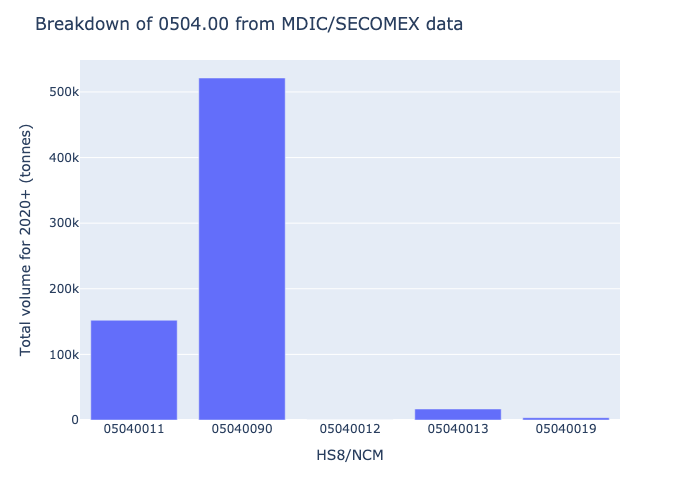
In the case of - 0504.00 – Guts, bladders and stomachs of animals (other than fish), HS8/NCM goes further and provides these breakdowns:
0504.00.11  Bovine tripas (casings)
0504.00.12  Sheep tripas (casings)
0504.00.13  Pork tripas (casings)
0504.00.19  Other animal tripas (not bovine, ovine, or swine)
0504.00.90  Other guts, bladders, or stomachs (non-specific)
It is therefore quite possible that ABIEC are filtering more precisely—perhaps restricting to HS8 0504.00.11—while SEI-PCS (via Trase) keeps the entire HS6 0504.00, inadvertently mixing in non-bovine casings into the beef dataset.