View or edit on GitHub
This page is synchronized from trase/data/brazil/trade/bol/y2025/qa.ipynb. Last modified on 2026-09-20 13:50 CEST by Nicolas Martin.
Please view or edit the original file there; changes should be reflected here after a midnight build (CET time),
or manually triggering it with a GitHub action (link).
from trase.tools.aws.aws_helpers import get_pandas_df
from trase.tools.aws.metadata import write_parquet_for_upload, write_csv_for_upload
import pandas as pd
import numpy as np
import re

pd.set_option('display.float_format', lambda x: '{:,.0f}'.format(x))
Config Session
PATH_DATASET = 'brazil/trade/bol/2025/bronze/brazil_bol_2025_soy_beef.csv'

PATH_SYNACOMEX = 'brazil/trade/traders/Synacomex_2025_data.xlsx'

INTEREST_COLS = {
    "DATES_LONG_HAUL_YYYYMMDD": "date",
    # hs codes
    "COMMODITY_HS_HS4_CODE": "hs4",
    "COMMODITY_HS_HS6_CODE": "hs6",
    "COMMODITY_HS_HS6_ENGLISH": "hs6_description",
    "COMMODITY_HS_HS8_CODE": "hs8",
    # exporters
    "COMPANY_SHIPPER_CITY": "exporter_municipality_label",
    "COMPANY_SHIPPER_REGISTRATION_NUMBER": "exporter_cnpj",
    "COMPANY_SHIPPER_SHIPPER_NAME_DETAILED": "exporter_label",
    "COMPANY_SHIPPER_STATE_NAME": "exporter_state_label",
    "PLACE_AND_PORTS_POL_COUNTRY": "exporter_country_label",  # Country were the shipment got loaded
    # ports, country
    "PLACE_AND_PORTS_POL_NAME": "port_of_export_label",
    "PLACE_AND_PORTS_POD_NAME": "port_of_import_label",
    "PLACE_AND_PORTS_POD_COUNTRY": "port_of_import_country_label",
    "PLACE_AND_PORTS_DEST_COUNTRY": "country_of_destination_label",
    # importer
    "COMPANY_CONSIGNEE_CONSIGNEE_NAME_DETAILED": "importer_label",
    # net_weight_kg, fob
    "MEASURES_WTKG": "net_weight_kg",
    "MEASURES_WTMT": "net_weight_tonnes",
    "MEASURES_SECEX_FOB": "fob",
}

SOY_HS4 = {
    "2304": "Soybean oilcake and other solid residue, wh/not ground",
    "1208": "Soybean flour / meal (ground soy products)",
    "1507": "Soya-bean oil and its fractions, whether or not refined, but not chemically modified",
    "1201": "Flours and meals of oil seeds or oleaginous fruits, other than those of mustard",
}

BEEF_HS4 = {
    "0102": "Live animals",
    "0201": "Fresh/chilled meat",
    "0202": "Frozen meat",
    "0206": "Fresh/chilled/frozen offal",
    "0210": "Dried/smoked/salted offal",
    "1602": "Preserved meat",
}
Load Data
df = get_pandas_df(key=PATH_DATASET, sep=';')

# Select interest columns
df[INTEREST_COLS.keys()]

# Add HS4 code
df['HS4_CODE'] = df['COMMODITY_HS_HS6_ENGLISH'].apply(lambda x: x[:4])
CNPJ or CPF with invalid number of digits (!= 11 or != 14)
df['cnpj'] = df['COMPANY_SHIPPER_REGISTRATION_NUMBER'].astype(str)

df[['cnpj', 'COMPANY_SHIPPER_CITY','COMPANY_SHIPPER_REGISTRATION_NUMBER','MEASURES_WTMT', 'HS4_CODE']].loc[
    (df['cnpj'].str.len() != 11) &
    (df['cnpj'].str.len() != 14)
]
| cnpj | COMPANY_SHIPPER_CITY | COMPANY_SHIPPER_REGISTRATION_NUMBER | MEASURES_WTMT | HS4_CODE | |
|---|---|---|---|---|---|
| 9 | 2916265018530 | PONTES E LACERDA | 2916265018530 | 29 | 0202 |
| 10 | 2916265023968 | ANASTACIO | 2916265023968 | 29 | 0202 |
| 11 | 2916265001646 | ARAPUTANGA | 2916265001646 | 29 | 0202 |
| 12 | 2916265023968 | ANASTACIO | 2916265023968 | 25 | 0202 |
| 13 | 2916265023968 | ANASTACIO | 2916265023968 | 0 | 0206 |
| ... | ... | ... | ... | ... | ... |
| 142095 | 2916265013652 | SANTANA DO ARAGUAIA | 2916265013652 | 28 | 0202 |
| 142096 | 2916265017640 | CONFRESA | 2916265017640 | 24 | 0202 |
| 142098 | 7302549000180 | PELOTAS | 7302549000180 | 1,638 | 0102 |
| 142100 | 7302549000180 | PELOTAS | 7302549000180 | 185 | 0102 |
| 142101 | 0 | NaN | 0 | 1,510 | 0102 |
86566 rows × 5 columns
Below we fix that by replacing comma by period and stripping
HS descriptions
df[['HS4_CODE','COMMODITY_HS_HS6_ENGLISH']].drop_duplicates().sort_values('HS4_CODE')
| HS4_CODE | COMMODITY_HS_HS6_ENGLISH | |
|---|---|---|
| 130769 | 0102 | 010290 - LIVE BOVINE ANIMALS - OTHER |
| 102140 | 0102 | 010229 - LIVE BOVINE ANIMALS - CATTLE - OTHER |
| 6499 | 0102 | 010200 - LIVE BOVINE ANIMALS |
| 59875 | 0201 | 020100 - MEAT OF BOVINE ANIMALS, FRESH OR CHILLED |
| 128230 | 0201 | 020120 - MEAT OF BOVINE ANIMALS, FRESH OR CHIL... |
| 477 | 0201 | 020130 - MEAT OF BOVINE ANIMALS, FRESH OR CHIL... |
| 9 | 0202 | 020230 - MEAT OF BOVINE ANIMALS, FROZEN - BONE... |
| 4613 | 0202 | 020200 - MEAT OF BOVINE ANIMALS, FROZEN |
| 81410 | 0202 | 020210 - MEAT OF BOVINE ANIMALS, FROZEN - CARC... |
| 57 | 0202 | 020220 - MEAT OF BOVINE ANIMALS, FROZEN - OTHE... |
| 10038 | 0206 | 020690 - EDIBLE OFFAL OF BOVINE ANIMALS, SWINE... |
| 23230 | 0206 | 020600 - EDIBLE OFFAL OF BOVINE ANIMALS, SWINE... |
| 47465 | 0206 | 020610 - EDIBLE OFFAL OF BOVINE ANIMALS, SWINE... |
| 281 | 0206 | 020641 - EDIBLE OFFAL OF BOVINE ANIMALS, SWINE... |
| 153 | 0206 | 020622 - EDIBLE OFFAL OF BOVINE ANIMALS, SWINE... |
| 61 | 0206 | 020621 - EDIBLE OFFAL OF BOVINE ANIMALS, SWINE... |
| 17 | 0206 | 020649 - EDIBLE OFFAL OF BOVINE ANIMALS, SWINE... |
| 13 | 0206 | 020629 - EDIBLE OFFAL OF BOVINE ANIMALS, SWINE... |
| 79455 | 0210 | 021019 - MEAT AND EDIBLE MEAT OFFAL, SALTED, I... |
| 23084 | 0210 | 021090 - MEAT AND EDIBLE MEAT OFFAL, SALTED, I... |
| 10801 | 0210 | 021020 - MEAT AND EDIBLE MEAT OFFAL, SALTED, I... |
| 101112 | 0210 | 021000 - MEAT AND EDIBLE MEAT OFFAL, SALTED, I... |
| 74039 | 0210 | 021011 - MEAT AND EDIBLE MEAT OFFAL, SALTED, I... |
| 0 | 0210 | 021099 - MEAT AND EDIBLE MEAT OFFAL, SALTED, I... |
| 25 | 0504 | 050400 - GUTS, BLADDERS AND STOMACHS OF ANIMAL... |
| 5633 | 1201 | 120190 - SOYA BEANS, WHETHER OR NOT BROKEN - O... |
| 111735 | 1201 | 120110 - SOYA BEANS, WHETHER OR NOT BROKEN - SEED |
| 532 | 1201 | 120100 - SOYA BEANS, WHETHER OR NOT BROKEN |
| 50958 | 1208 | 120890 - FLOURS AND MEALS OF OIL SEEDS OR OLEA... |
| 46577 | 1208 | 120810 - FLOURS AND MEALS OF OIL SEEDS OR OLEA... |
| 549 | 1507 | 150790 - SOYA-BEAN OIL AND ITS FRACTIONS, WHET... |
| 8375 | 1507 | 150700 - SOYA-BEAN OIL AND ITS FRACTIONS, WHET... |
| 2849 | 1507 | 150710 - SOYA-BEAN OIL AND ITS FRACTIONS, WHET... |
| 43187 | 1602 | 160290 - OTHER PREPARED OR PRESERVED MEAT, MEA... |
| 1287 | 1602 | 160231 - OTHER PREPARED OR PRESERVED MEAT, MEA... |
| 1854 | 1602 | 160230 - OTHER PREPARED OR PRESERVED MEAT, MEA... |
| 6291 | 1602 | 160200 - OTHER PREPARED OR PRESERVED MEAT, MEA... |
| 65 | 1602 | 160250 - OTHER PREPARED OR PRESERVED MEAT, MEA... |
| 11949 | 1602 | 160220 - OTHER PREPARED OR PRESERVED MEAT, MEA... |
| 88212 | 1602 | 160239 - OTHER PREPARED OR PRESERVED MEAT, MEA... |
| 22 | 1602 | 160232 - OTHER PREPARED OR PRESERVED MEAT, MEA... |
| 16 | 1602 | 160249 - OTHER PREPARED OR PRESERVED MEAT, MEA... |
| 12542 | 2302 | 230240 - BRAN, SHARPS AND OTHER RESIDUES, WHET... |
| 114864 | 2302 | 230230 - BRAN, SHARPS AND OTHER RESIDUES, WHET... |
| 23802 | 2302 | 230210 - BRAN, SHARPS AND OTHER RESIDUES, WHET... |
| 9684 | 2302 | 230200 - BRAN, SHARPS AND OTHER RESIDUES, WHET... |
| 284 | 2304 | 230400 - OIL-CAKE AND OTHER SOLID RESIDUES, WH... |
Soy exports by product
df_soy = df.loc[df['HS4_CODE'].isin(SOY_HS4.keys())]

df_soy_totals = df_soy.groupby(by=['HS4_CODE'])['MEASURES_WTKG'].sum().div(1000)

df_soy_total_fob = df_soy.groupby(by=['HS4_CODE'])['MEASURES_SECEX_FOB'].sum()
Beef exports by product
df_beef = df.loc[df['HS4_CODE'].isin(BEEF_HS4.keys())]

df_beef_totals = df_beef.groupby(by=['HS4_CODE'])['MEASURES_WTKG'].sum().div(1000)
df_beef_totals_fob = df_beef.groupby(by=['HS4_CODE'])['MEASURES_SECEX_FOB'].sum()
Comparing with SECOMEX
df_contrade = get_pandas_df(key=PATH_SYNACOMEX, xlsx=True)

df_contrade['HS4_CODE'] = df_contrade['SH4 Code'].apply(
    lambda x: '0' + str(x) if len(str(x)) == 3 else str(x)
)

df_contrade['MEASURES_WTMT'] = df_contrade['2025 - Net Weight'].astype(float)
df_contrade['MEASURES_SECEX_FOB'] = df_contrade['2025 - US$ FOB'].astype(float)
df_contrade['MEASURES_WTMT'] = df_contrade['MEASURES_WTMT'].div(1000)
import matplotlib.pyplot as plt
import numpy as np
import pandas as pd

# 1. Group the reference dataset by HS4_CODE to get the total weights
# (Assuming df_contrade is already loaded and formatted as per your snippet)
comtrade_totals = df_contrade.groupby('HS4_CODE')['MEASURES_WTMT'].sum()


# ==========================================
# --- Beef chart (Side-by-Side Comparison) ---
# ==========================================

# Align your data and the reference data using a DataFrame
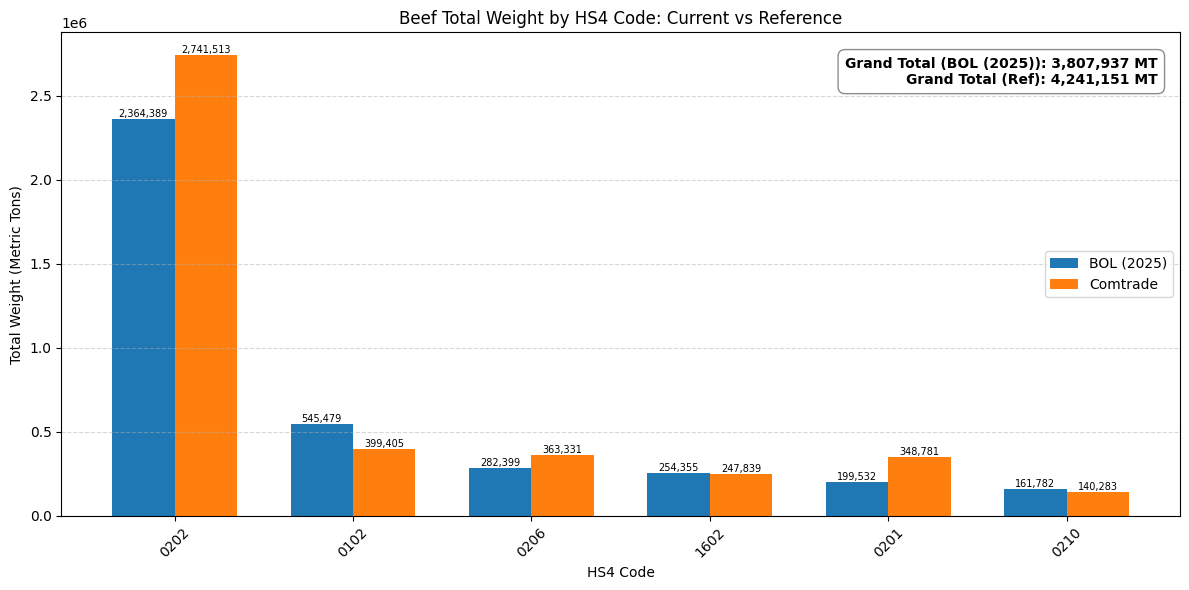
df_beef_combined = pd.DataFrame({
    'BOL (2025)': df_beef_totals,
    'Comtrade (2025)': comtrade_totals
})

# Keep only the HS4 codes present in your original data, fill missing Comtrade matches with 0
df_beef_combined = df_beef_combined.loc[df_beef_totals.index].fillna(0)
# Sort by your data just like before
df_beef_combined = df_beef_combined.sort_values(by='BOL (2025)', ascending=False)

# Setup for grouped bars
x_beef = np.arange(len(df_beef_combined))
width = 0.35  # Width of the bars

fig, ax = plt.subplots(figsize=(12, 6))
bars1_beef = ax.bar(x_beef - width/2, df_beef_combined['BOL (2025)'], width, label='BOL (2025)', color='#1f77b4')
bars2_beef = ax.bar(x_beef + width/2, df_beef_combined['Comtrade (2025)'], width, label='Comtrade', color='#ff7f0e')

ax.set_title('Beef Total Weight by HS4 Code: Current vs Reference')
ax.set_xlabel('HS4 Code')
ax.set_ylabel('Total Weight (Metric Tons)')
ax.set_xticks(x_beef)
ax.set_xticklabels(df_beef_combined.index.astype(str), rotation=45)
ax.grid(axis='y', linestyle='--', alpha=0.5)
ax.legend()

# Value labels (filtering out 0s so it doesn't get visually cluttered)
for bars in [bars1_beef, bars2_beef]:
    for bar in bars:
        height = bar.get_height()
        if height > 0:
            ax.text(bar.get_x() + bar.get_width()/2., height, f'{height:,.0f}',
                    ha='center', va='bottom', fontsize=7)

# Update Annotation Box with both totals
beef_total_yours = df_beef_combined['BOL (2025)'].sum()
beef_total_ref = df_beef_combined['Comtrade (2025)'].sum()
text_beef = f'Grand Total (BOL (2025)): {beef_total_yours:,.0f} MT\nGrand Total (Ref): {beef_total_ref:,.0f} MT'

ax.text(0.98, 0.95, text_beef, transform=ax.transAxes,
        fontsize=10, fontweight='bold', va='top', ha='right',
        bbox=dict(boxstyle='round,pad=0.5', facecolor='white', alpha=0.9, edgecolor='gray'))

plt.tight_layout()
plt.show()


# ==========================================
# --- Soy chart (Side-by-Side Comparison) ---
# ==========================================

# Align your data and the reference data using a DataFrame
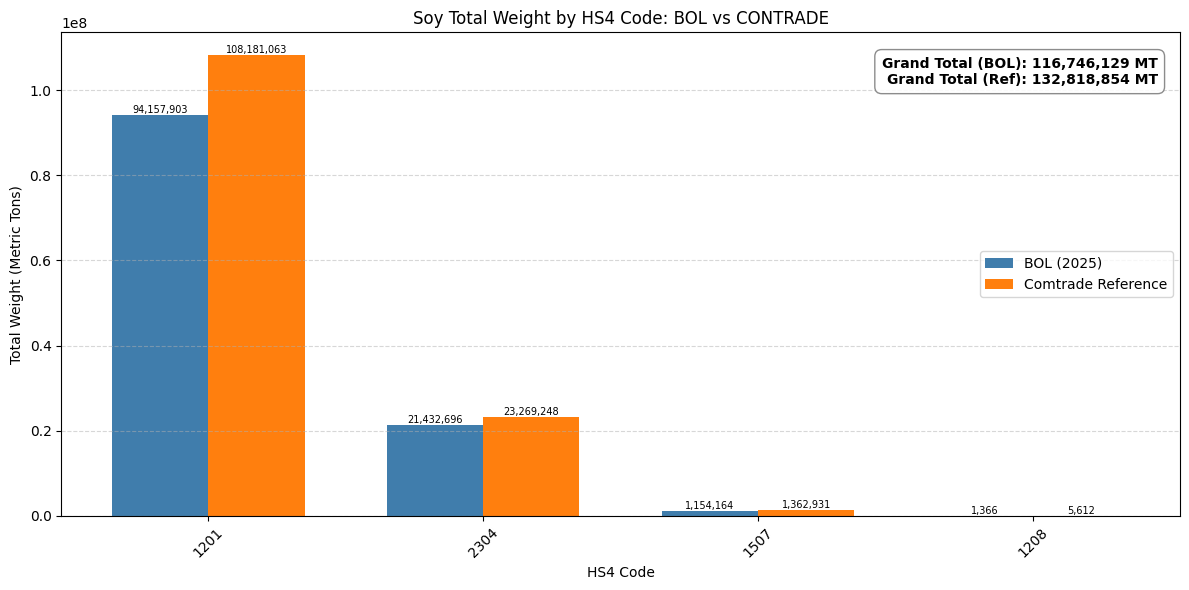
df_soy_combined = pd.DataFrame({
    'BOL (2025)': df_soy_totals,
    'Comtrade (2025)': comtrade_totals
})

# Keep only the HS4 codes present in your original data, fill missing Comtrade matches with 0
df_soy_combined = df_soy_combined.loc[df_soy_totals.index].fillna(0)
# Sort by your data just like before
df_soy_combined = df_soy_combined.sort_values(by='BOL (2025)', ascending=False)

# Setup for grouped bars
x_soy = np.arange(len(df_soy_combined))

fig, ax = plt.subplots(figsize=(12, 6))
bars1_soy = ax.bar(x_soy - width/2, df_soy_combined['BOL (2025)'], width, label='BOL (2025)', color="#407dac") # Green for Soy
bars2_soy = ax.bar(x_soy + width/2, df_soy_combined['Comtrade (2025)'], width, label='Comtrade Reference', color='#ff7f0e')

ax.set_title('Soy Total Weight by HS4 Code: BOL vs CONTRADE')
ax.set_xlabel('HS4 Code')
ax.set_ylabel('Total Weight (Metric Tons)')
ax.set_xticks(x_soy)
ax.set_xticklabels(df_soy_combined.index.astype(str), rotation=45)
ax.grid(axis='y', linestyle='--', alpha=0.5)
ax.legend()

# Value labels (filtering out 0s)
for bars in [bars1_soy, bars2_soy]:
    for bar in bars:
        height = bar.get_height()
        if height > 0:
            ax.text(bar.get_x() + bar.get_width()/2., height, f'{height:,.0f}',
                    ha='center', va='bottom', fontsize=7)

# Update Annotation Box with both totals
soy_total_yours = df_soy_combined['BOL (2025)'].sum()
soy_total_ref = df_soy_combined['Comtrade (2025)'].sum()
text_soy = f'Grand Total (BOL): {soy_total_yours:,.0f} MT\nGrand Total (Ref): {soy_total_ref:,.0f} MT'

ax.text(0.98, 0.95, text_soy, transform=ax.transAxes,
        fontsize=10, fontweight='bold', va='top', ha='right',
        bbox=dict(boxstyle='round,pad=0.5', facecolor='white', alpha=0.9, edgecolor='gray'))

plt.tight_layout()
plt.show()
# ==========================
# --- Beef FOB (Side-by-Side) ---
# ==========================

df_beef_totals_fob = df_beef.groupby('HS4_CODE')['MEASURES_SECEX_FOB'].sum()
comtrade_totals_fob = df_contrade.groupby('HS4_CODE')['MEASURES_SECEX_FOB'].sum()

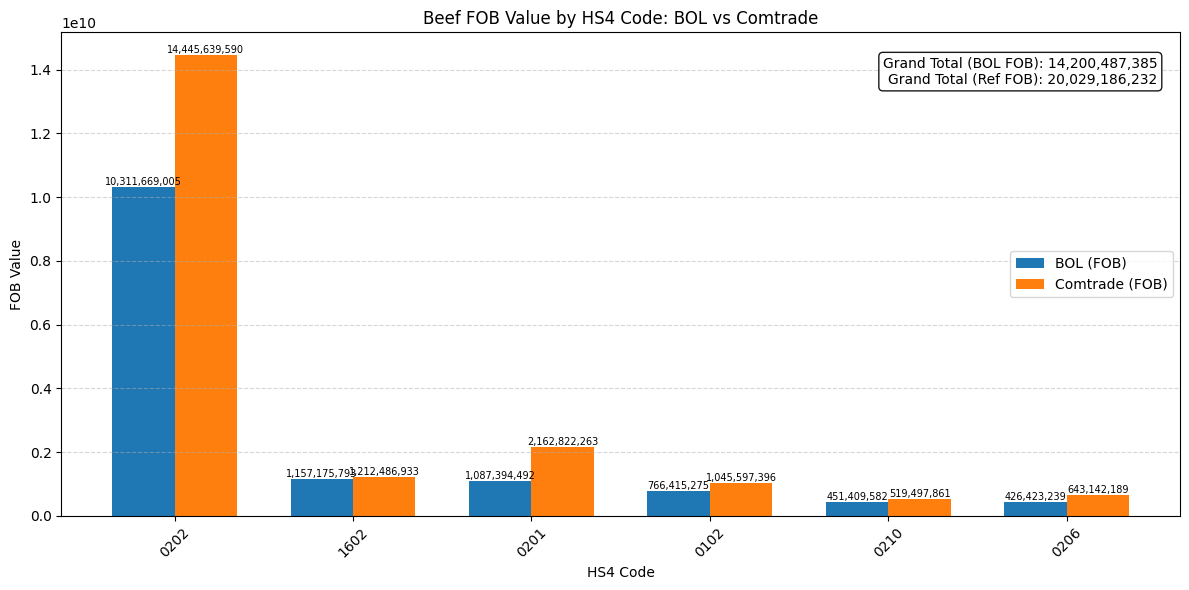
df_beef_combined_fob = pd.DataFrame({
    'BOL (FOB)': df_beef_totals_fob,
    'Comtrade (FOB)': comtrade_totals_fob
})

df_beef_combined_fob = df_beef_combined_fob.loc[df_beef_totals_fob.index].fillna(0)
df_beef_combined_fob = df_beef_combined_fob.sort_values(by='BOL (FOB)', ascending=False)

x_beef = np.arange(len(df_beef_combined_fob))
width = 0.35

fig, ax = plt.subplots(figsize=(12, 6))

bars1 = ax.bar(x_beef - width/2, df_beef_combined_fob['BOL (FOB)'], width,
               label='BOL (FOB)', color='#1f77b4')

bars2 = ax.bar(x_beef + width/2, df_beef_combined_fob['Comtrade (FOB)'], width,
               label='Comtrade (FOB)', color='#ff7f0e')

ax.set_title('Beef FOB Value by HS4 Code: BOL vs Comtrade')
ax.set_xlabel('HS4 Code')
ax.set_ylabel('FOB Value')
ax.set_xticks(x_beef)
ax.set_xticklabels(df_beef_combined_fob.index.astype(str), rotation=45)
ax.grid(axis='y', linestyle='--', alpha=0.5)
ax.legend()

for bars in [bars1, bars2]:
    for bar in bars:
        h = bar.get_height()
        if h > 0:
            ax.text(bar.get_x() + bar.get_width()/2, h, f'{h:,.0f}',
                    ha='center', va='bottom', fontsize=7)

beef_total = df_beef_combined_fob['BOL (FOB)'].sum()
beef_ref = df_beef_combined_fob['Comtrade (FOB)'].sum()

ax.text(0.98, 0.95,
        f'Grand Total (BOL FOB): {beef_total:,.0f}\nGrand Total (Ref FOB): {beef_ref:,.0f}',
        transform=ax.transAxes, ha='right', va='top',
        bbox=dict(boxstyle='round', facecolor='white', alpha=0.9))

plt.tight_layout()
plt.show()
# ==========================
# --- Soy FOB (Side-by-Side) ---
# ==========================

df_soy_totals_fob = df_soy.groupby('HS4_CODE')['MEASURES_SECEX_FOB'].sum()
comtrade_totals_fob = df_contrade.groupby('HS4_CODE')['MEASURES_SECEX_FOB'].sum()

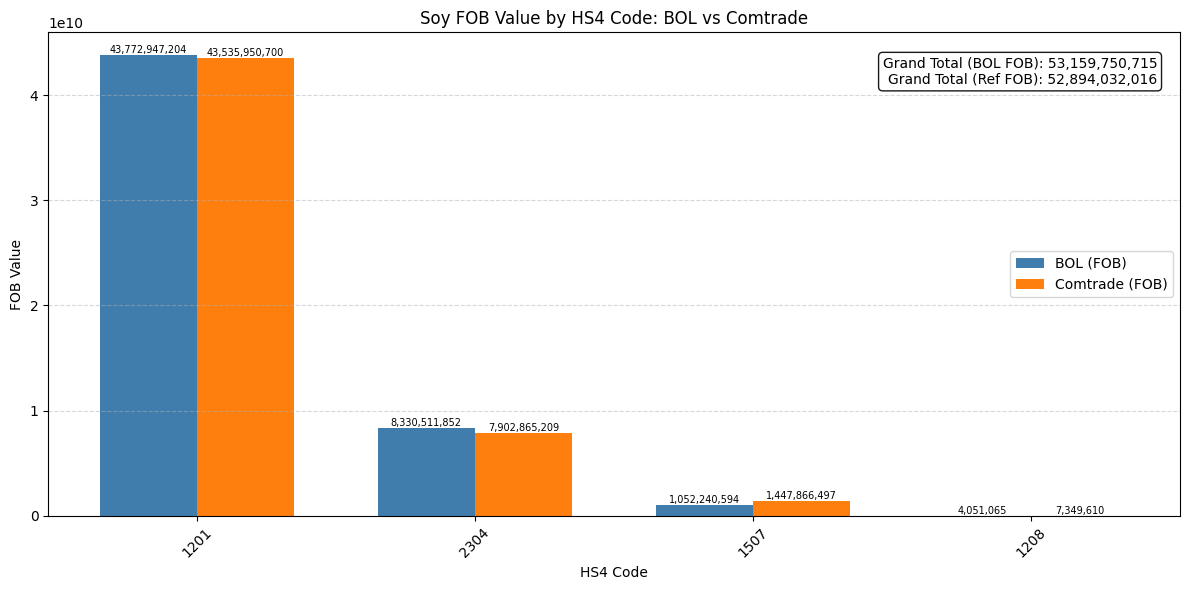
df_soy_combined_fob = pd.DataFrame({
    'BOL (FOB)': df_soy_totals_fob,
    'Comtrade (FOB)': comtrade_totals_fob
})

df_soy_combined_fob = df_soy_combined_fob.loc[df_soy_totals_fob.index].fillna(0)
df_soy_combined_fob = df_soy_combined_fob.sort_values(by='BOL (FOB)', ascending=False)

x_soy = np.arange(len(df_soy_combined_fob))

fig, ax = plt.subplots(figsize=(12, 6))

bars1 = ax.bar(x_soy - width/2, df_soy_combined_fob['BOL (FOB)'], width,
               label='BOL (FOB)', color='#407dac')

bars2 = ax.bar(x_soy + width/2, df_soy_combined_fob['Comtrade (FOB)'], width,
               label='Comtrade (FOB)', color='#ff7f0e')

ax.set_title('Soy FOB Value by HS4 Code: BOL vs Comtrade')
ax.set_xlabel('HS4 Code')
ax.set_ylabel('FOB Value')
ax.set_xticks(x_soy)
ax.set_xticklabels(df_soy_combined_fob.index.astype(str), rotation=45)
ax.grid(axis='y', linestyle='--', alpha=0.5)
ax.legend()

for bars in [bars1, bars2]:
    for bar in bars:
        h = bar.get_height()
        if h > 0:
            ax.text(bar.get_x() + bar.get_width()/2, h, f'{h:,.0f}',
                    ha='center', va='bottom', fontsize=7)

soy_total = df_soy_combined_fob['BOL (FOB)'].sum()
soy_ref = df_soy_combined_fob['Comtrade (FOB)'].sum()

ax.text(0.98, 0.95,
        f'Grand Total (BOL FOB): {soy_total:,.0f}\nGrand Total (Ref FOB): {soy_ref:,.0f}',
        transform=ax.transAxes, ha='right', va='top',
        bbox=dict(boxstyle='round', facecolor='white', alpha=0.9))

plt.tight_layout()
plt.show()
# ==========================
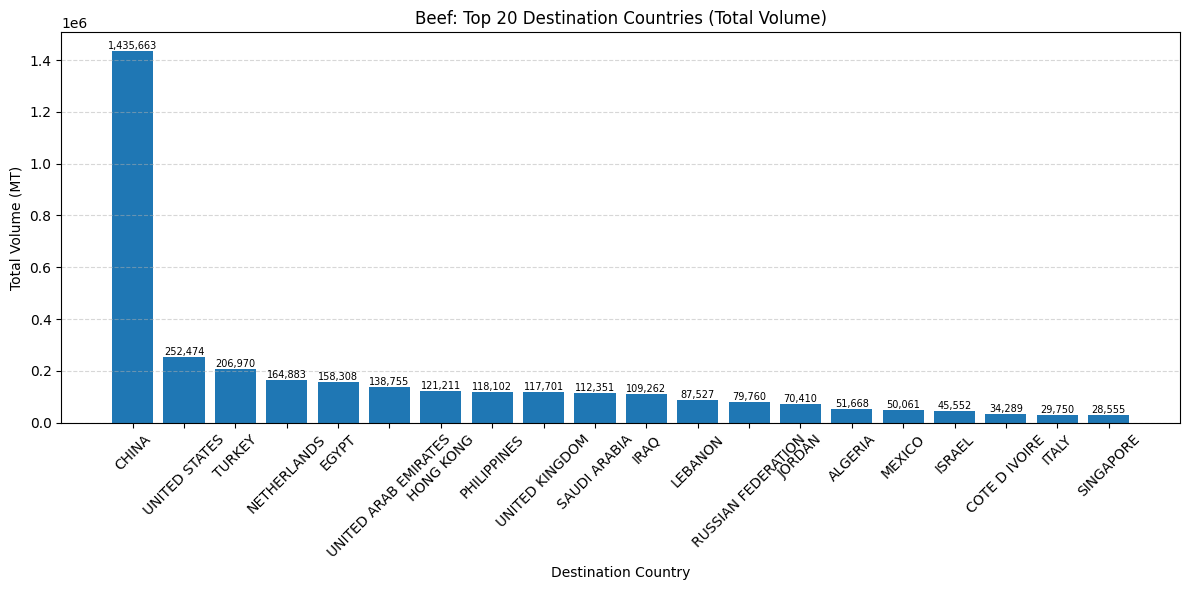
# --- Beef: Top 20 Destinations ---
# ==========================

df_beef_dest = df.loc[df['HS4_CODE'].isin(BEEF_HS4.keys())]

beef_dest_totals = (
    df_beef_dest
    .groupby('PLACE_AND_PORTS_DEST_COUNTRY')['MEASURES_WTMT']
    .sum()
    .sort_values(ascending=False)
    .head(20)
)

fig, ax = plt.subplots(figsize=(12, 6))

ax.bar(beef_dest_totals.index, beef_dest_totals.values, color='#1f77b4')

ax.set_title('Beef: Top 20 Destination Countries (Total Volume)')
ax.set_xlabel('Destination Country')
ax.set_ylabel('Total Volume (MT)')
ax.tick_params(axis='x', rotation=45)
ax.grid(axis='y', linestyle='--', alpha=0.5)

# value labels
for i, v in enumerate(beef_dest_totals.values):
    ax.text(i, v, f'{v:,.0f}', ha='center', va='bottom', fontsize=7)

plt.tight_layout()
plt.show()
import matplotlib.pyplot as plt

# ==========================
# --- Soy: Top 20 Destinations per HS Code ---
# ==========================

# Iterate over each HS code in your dictionary/list
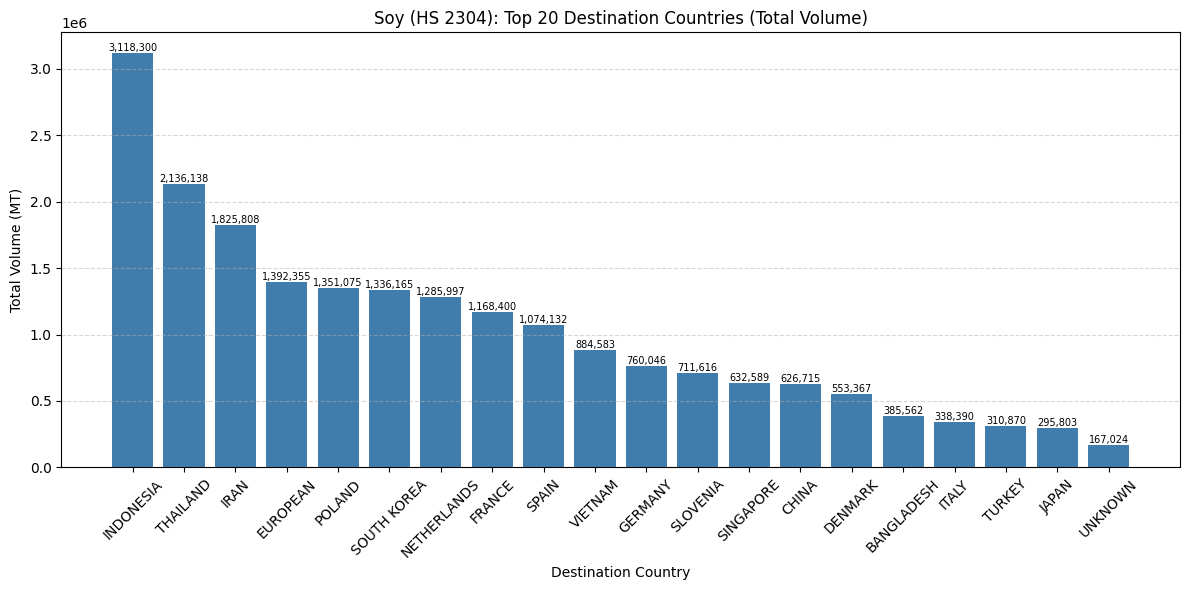
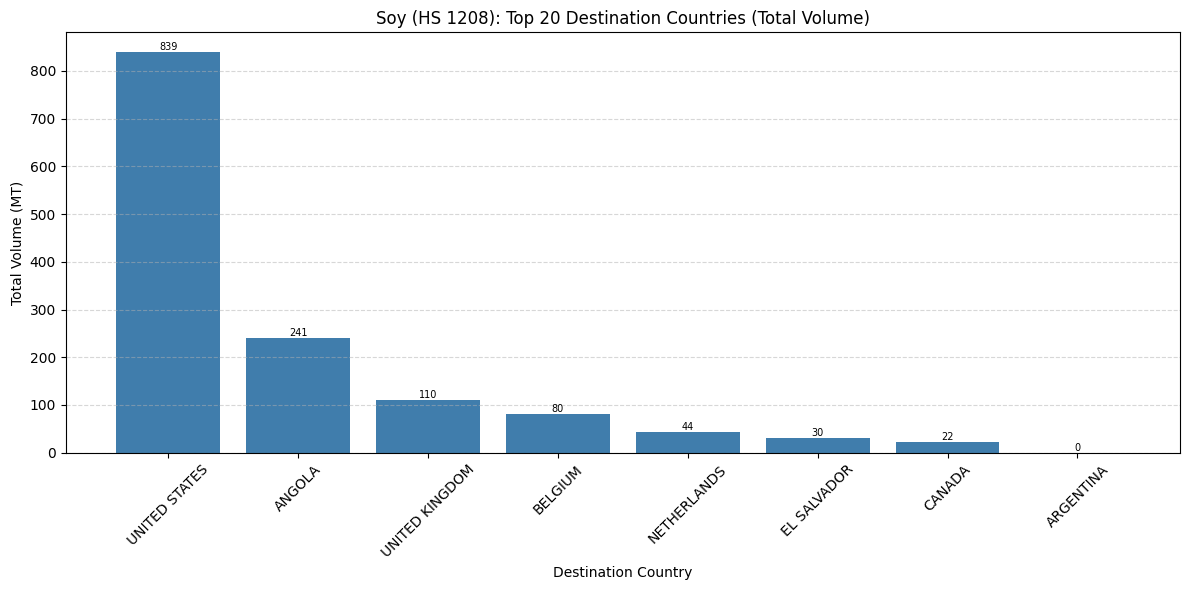
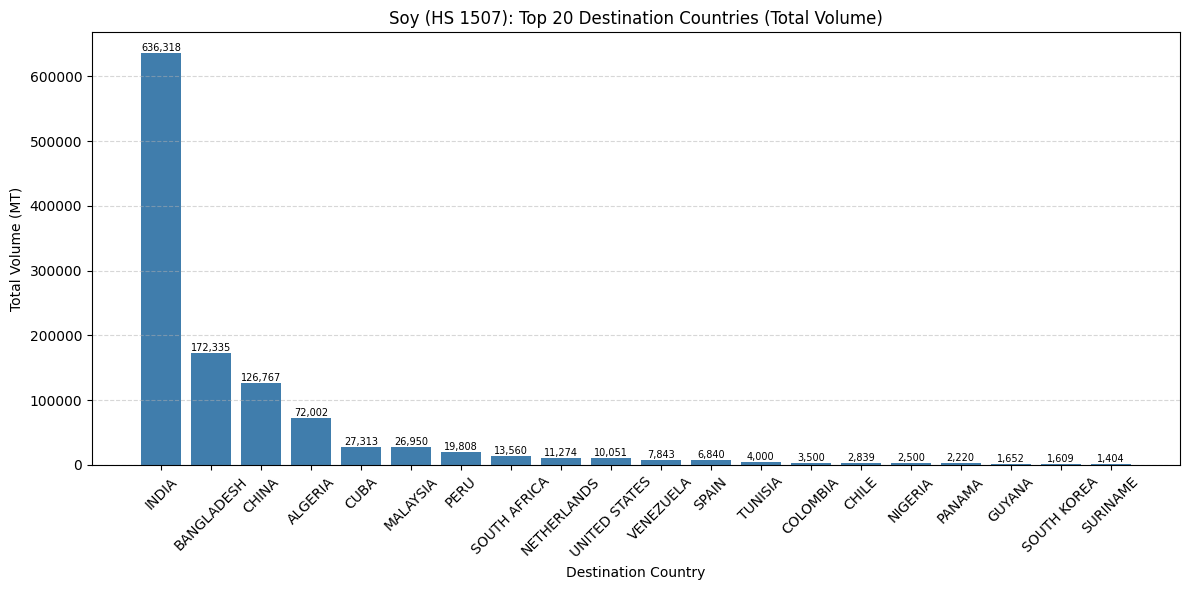
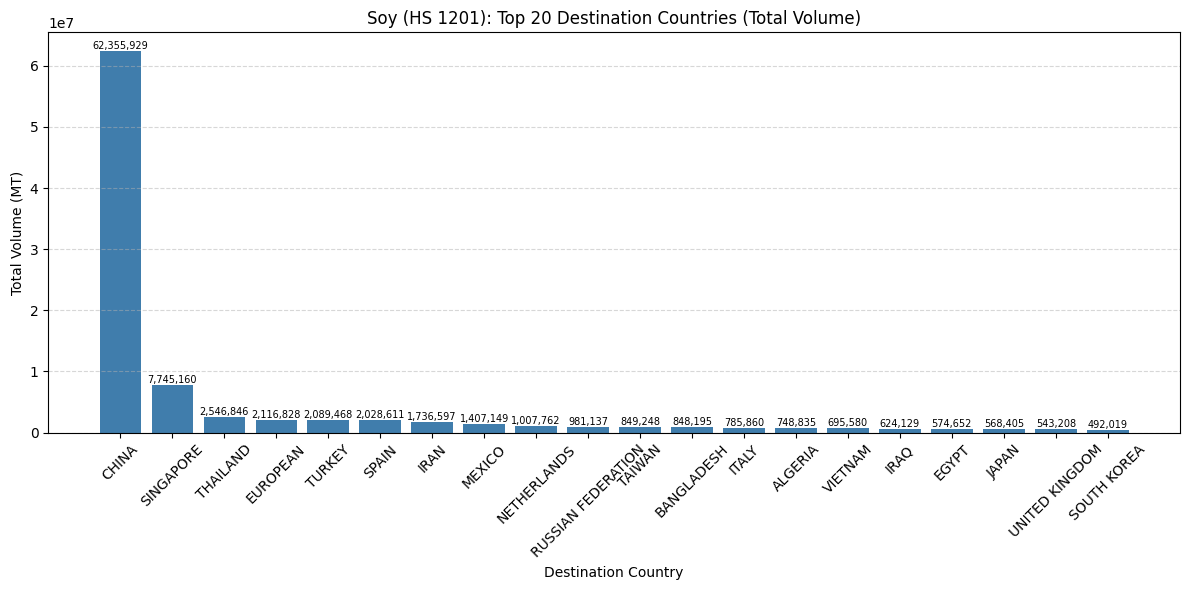
for hs_code in SOY_HS4.keys():

    # 1. Filter the DataFrame for the current HS code
    df_single_hs = df[df['HS4_CODE'] == hs_code]

    # Skip if there is no data for this HS code
    if df_single_hs.empty:
        continue

    # 2. Group and aggregate data for this specific HS code
    soy_dest_totals = (
        df_single_hs
        .groupby('PLACE_AND_PORTS_DEST_COUNTRY')['MEASURES_WTMT']
        .sum()
        .sort_values(ascending=False)
        .head(20)
    )

    # 3. Create the plot
    fig, ax = plt.subplots(figsize=(12, 6))

    ax.bar(soy_dest_totals.index, soy_dest_totals.values, color='#407dac')

    # If SOY_HS4 is a dictionary (e.g., {'1201': 'Soybeans'}), you can use the value for the title:
    # hs_name = SOY_HS4[hs_code]
    # ax.set_title(f'{hs_name} (HS {hs_code}): Top 20 Destination Countries (Total Volume)')

    # Standard title using just the code:
    ax.set_title(f'Soy (HS {hs_code}): Top 20 Destination Countries (Total Volume)')

    ax.set_xlabel('Destination Country')
    ax.set_ylabel('Total Volume (MT)')
    ax.tick_params(axis='x', rotation=45)
    ax.grid(axis='y', linestyle='--', alpha=0.5)

    # 4. Add value labels
    for i, v in enumerate(soy_dest_totals.values):
        ax.text(i, v, f'{v:,.0f}', ha='center', va='bottom', fontsize=7)

    plt.tight_layout()
    plt.show()