View or edit on GitHub
This page is synchronized from trase/data/brazil/soy/indicators/ghgp/qa.md. Last modified on 2026-09-20 13:50 CEST by Nicolas Martin.
Please view or edit the original file there; changes should be reflected here after a midnight build (CET time),
or manually triggering it with a GitHub action (link).
Soy Conversions and Emissions QA
- How much soy was converted in the last 20 years ?
- Orbae vs. Mapbiomas comparison
- What is the carbon emission break down ?
- What the geographical distribution of emissions ?
- What are the LULC emission factors per unit of soy production (t CO₂ / t soy) ?
- National average emission factor (t CO₂ / t soy)
- Emission factor maps by LULC type (per unit of soy production)
How much soy was converted in the last 20 years ?
63.86%
The amount above was calculated by analyzing all soy pixels in 2023 that were not classified as soy in 2003. Orbae reports ~73% of land conversion. This is the first source of difference in the results presented here.
| conversion_area | percent | ||
|---|---|---|---|
| year | conversion_type | ||
| 2023 | forest | 3,634,289.32 | 8.70 |
| non_forest | 1,658,555.81 | 3.97 | |
| others | 13,041,315.45 | 31.22 | |
| pasture | 8,346,030.58 | 19.98 |
Orbae vs. Mapbiomas comparison
The observed differences in the table below can be attributed primarily to the distinct datasets used for soy mapping. GLAD tends to underreport soy coverage in earlier years while maps more soy in more recent years compared to Mapbiomas. Consequently, this leads to discrepancies in the estimated converted areas under the 20-year allocation window.
The main divergence arises in the treatment of natural grassland conversion. Trase relies on PRODES/MapBiomas information, whereas Orbae applies a different methodological framework.
Orbae uses a deductive approach developed by AdAstra to estimate the conversion of non-forest native ecosystems, which are referred to by convention as “natural grasslands.” Rather than directly identifying a land-cover transition from natural grassland to cropland, the methodology estimates potential grassland conversion indirectly from crop expansion that cannot be > attributed to other land uses.
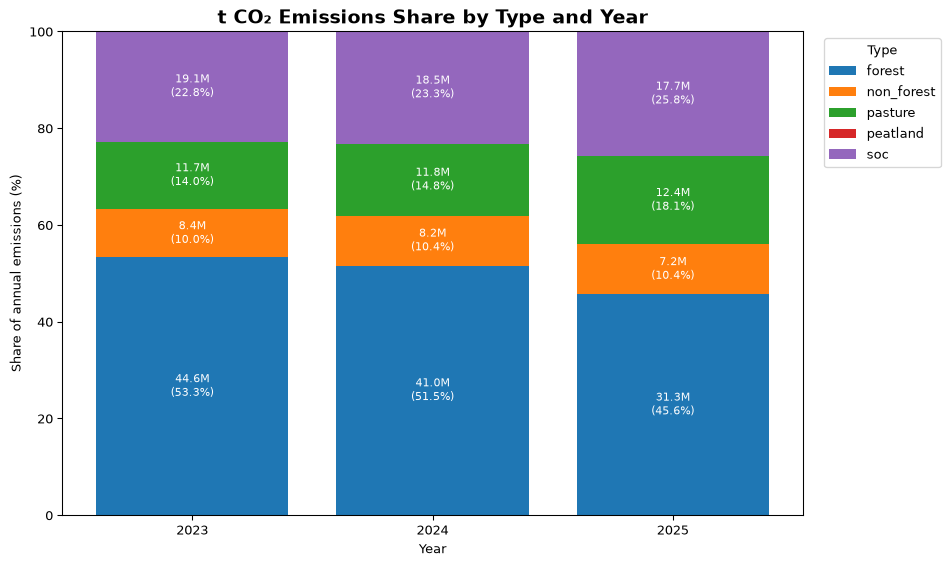
What is the carbon emission break down ?
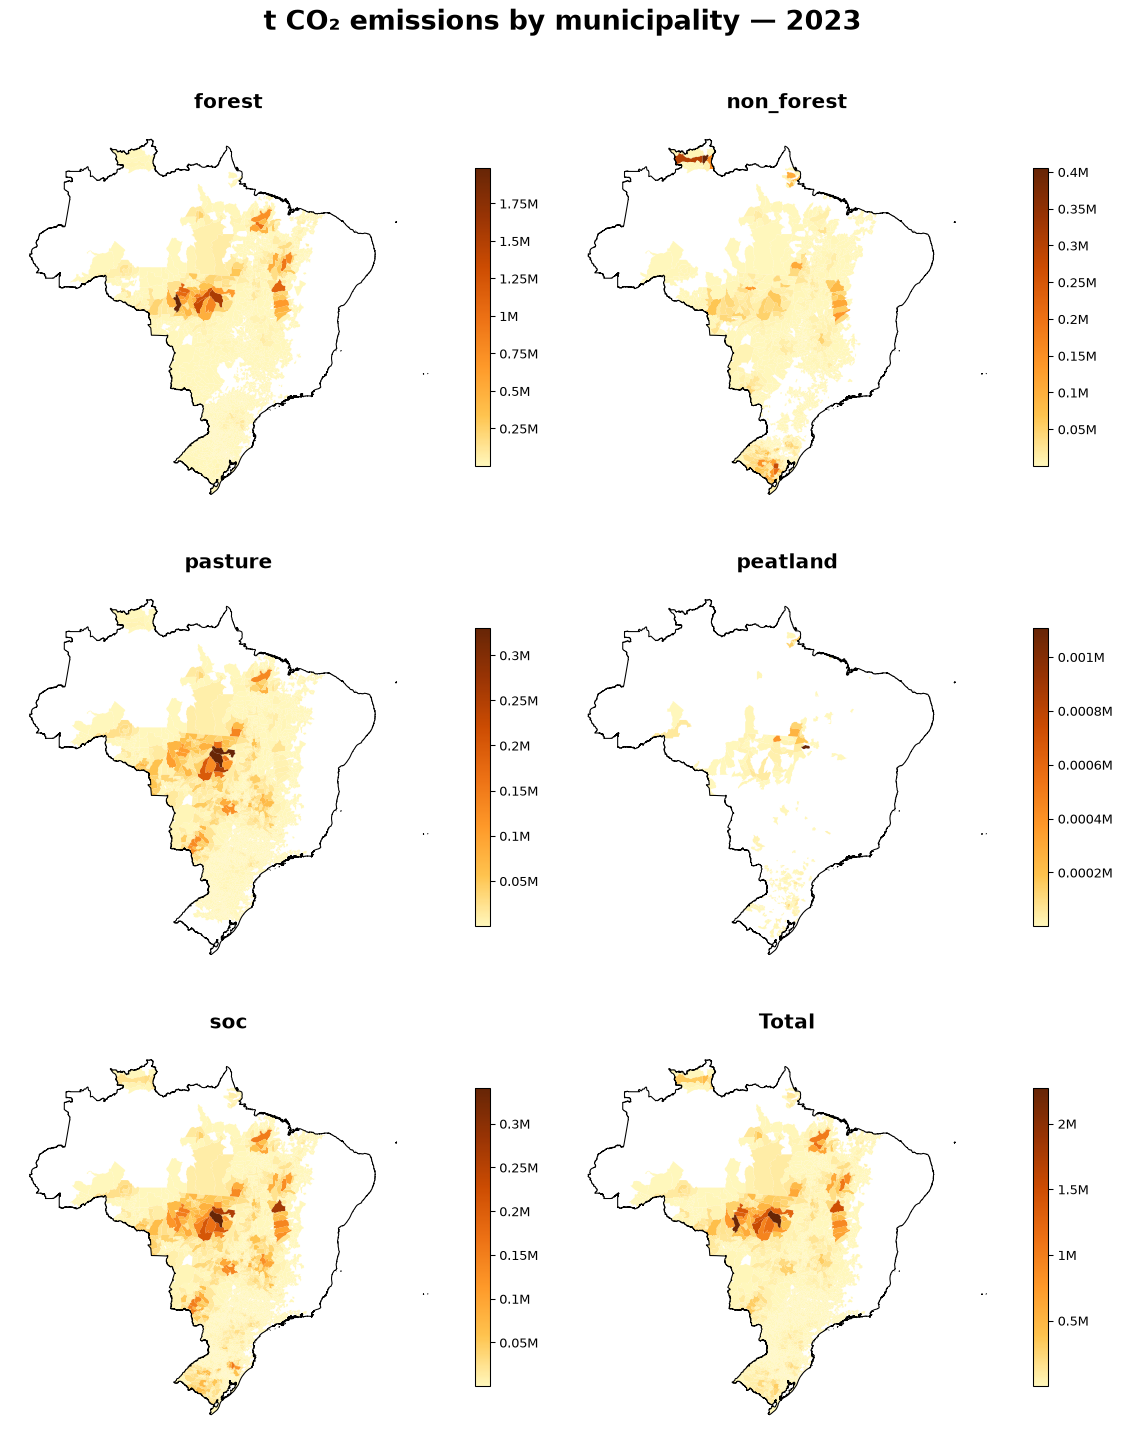
What the geographical distribution of emissions ?
What are the LULC emission factors per unit of soy production (t CO₂ / t soy) ?
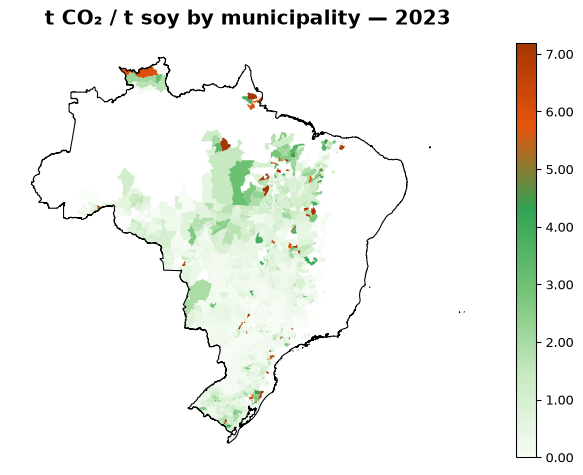
National average emission factor (t CO₂ / t soy)
Orbae reports an emission factor of 0.915, which is significantly higher than the calculated value below. These discrepancies can be partly attributed to differences in soy datasets. However, it is important to note that soy production values differ substantially between the two sources. While Trase relies on IBGE production data, Orbae uses yield estimates from CONAB. One example is the municipality of Jacareacanga with 475 t of soybean while IBGE reports 0 production
0.5502 t CO2 / t soy
Emission factor maps by LULC type (per unit of soy production)