View or edit on GitHub
This page is synchronized from trase/data/brazil/logistics/slaughterhouses/slaughterhouse_map_v6/LogisticHubs_Comparison.md. Last modified on 2026-06-21 06:35 CEST by GitHub Actions.
Please view or edit the original file there; changes should be reflected here after a midnight build (CET time),
or manually triggering it with a GitHub action (link).
Logistic Hubs: Comparison between versions
Thais Pacheco Menezes 2026-04-10
Data Loading
lh_previous <- s3read_using(
  object = paste0(
    "brazil/logistics/slaughterhouses/slaughterhouse_map_v5/2025-03-25-br_beef_logistics_map_v5_new.csv"
  ),
  FUN = read.csv,
  bucket = "trase-storage",
  opts = c("check_region" = T)
)

lh_current <- s3read_using(
  object = paste0(
    "brazil/logistics/slaughterhouses/slaughterhouse_map_v6/2026-03-23-br_logistics_map_v6.csv"
  ),
  FUN = read.csv,
  bucket = "trase-storage",
  opts = c("check_region" = T)
)
General Summary
| Metric | LogisticsHub V5 | LogisticsHub V6 | Difference |
|---|---|---|---|
| Rows | 18018 | 16884 | -1134 |
| Columns | 23 | 28 | 5 |
| Distinct facilities | 11943 | 14259 | 2316 |
| Distinct CNPJs | 9997 | 13652 | 3655 |
LogisticsHub V6 contains 16884 rows and 28 columns, compared to 18018 rows and 23 columns in V5, representing a difference of -1134 rows and 5 additional columns. In terms of coverage, V6 contains 14259 distinct facilities associated with 13652 distinct CNPJs, compared to 11943 facilities and 9997 CNPJs in V5.
Overall, V5 contained more rows than V6 despite covering fewer distinct facilities and CNPJs. This is explained by the fact that a single facility appears in multiple rows when it is associated with more than one commodity — meaning that a higher row count relative to facility count reflects a higher average number of commodities assigned per facility. In V5, the commodity classification was broader, leading to more commodity-facility associations per record. In V6, improvements in the code used to derive the commodity variable, combined with the incorporation of species-specific information to define the field used for commodity lookup, resulted in a more precise classification. As a consequence, facilities in V6 are associated with fewer but more accurate commodities, which reduced the total row count even as the number of distinct facilities increased (on average, each facility in V5 was associated with 1.51 commodities, compared to 1.18 in V6).
Difference in commodity:
| Statistic | LogisticsHub V5 | LogisticsHub V6 |
|---|---|---|
| Min | 1.00 | 1.00 |
| 1st Qu. | 1.00 | 1.00 |
| Median | 1.00 | 1.00 |
| Mean | 1.51 | 1.18 |
| 3rd Qu. | 1.00 | 1.00 |
| Max | 8.00 | 7.00 |
Comparison per STATE
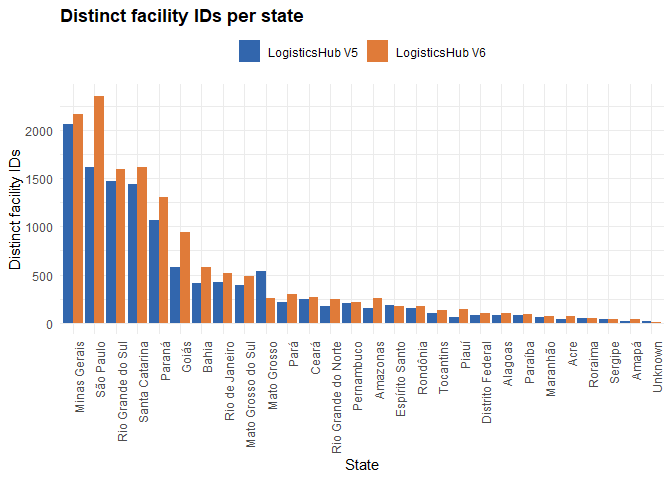
Looking at the number of distinct facilities per state, the most notable shift between versions is at the top: Minas Gerais held the highest count in V5, but São Paulo now leads in V6, with Minas Gerais dropping to second place. Both states still sit well above the rest, but their ranking has swapped. For the majority of states, the total number of facilities increased from V5 to V6, suggesting the dataset has grown in coverage. However, there are a few exceptions where facility counts actually declined: Mato Grosso for example is the most visible one in the chart, but Espirito Santo also appear to have slightly fewer facilities in V6 than in V5.
The “Unknown” state category, visible at the far right, is negligible in both versions and appears to have decreased further in V6, which may reflect improved geocoding or data cleaning in the current release.
Comparison per COMMODITY
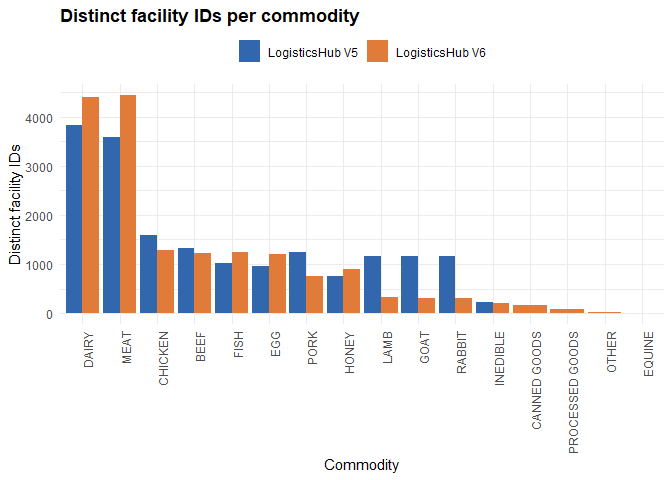
Note: the same facility can be associated with more than one commodity!
Regarding commodity composition, Dairy and Meat remain the two most representative categories in both versions, and both saw an increase in the number of associated facilities from V5 to V6. Fish, egg, and honey also recorded gains in V6. In contrast, chicken and beef show a slight decrease in associated facilities when comparing V6 to V5, while pork presents a more pronounced reduction. The sharpest declines, however, are seen in lamb, goat, and rabbit. This is likely explained by a methodological change between versions: in V5, facilities categorized generically as slaughterhouses — without species specification — were assigned to all of these commodities simultaneously. In V6, commodity classification was refined to also rely on a species-specific field, meaning that unspecified slaughterhouses are no longer automatically mapped to less common species.Additionally, improvements in the underlying code made the commodity search more accurate overall. As a result, the drop in lamb, goat, and rabbit counts reflects a correction in classification logic rather than a real-world reduction in facilities.
Finally, V6 introduces four commodity categories that had no representation in V5: canned goods, processed goods, other, and equine. These additions suggest an expansion in the scope of facility types being tracked in the current version.
Comparison per INSPECTION_LEVEL
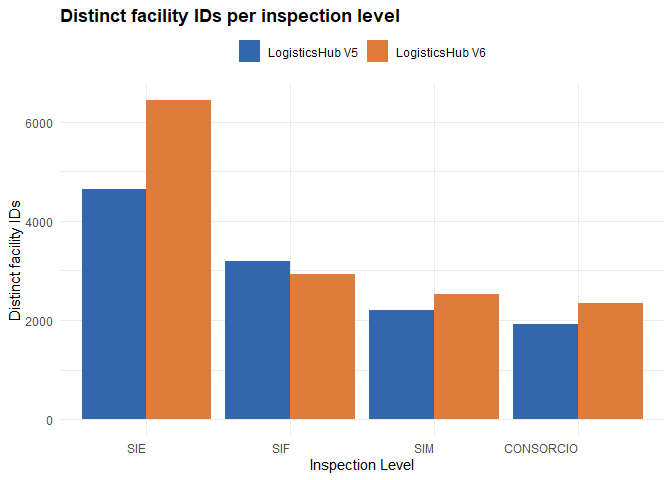
Regarding inspection levels, V6 shows a notable increase in facilities registered at the state-level inspection (SIE) compared to V5. This can largely be attributed to a methodological expansion in data sourcing: in V5, all SIE facilities were sourced exclusively from the SISBI database, which does not capture all state-registered facilities. In V6, the approach include not only SIF and SISBI data but also direct downloads from each state inspection systems, resulting in more comprehensive coverage of state-level inspected facilities.
Beyond SIE, a small decrease is observed in SIF facilities, while SIM and CONSÓRCIO both show increases in V6 relative to V5.