View or edit on GitHub
This page is synchronized from trase/data/indonesia/palm_oil/indicators/q1_2024/quality_assessment/QA_metrics.md. Last modified on 2026-03-21 22:30 CET by Trase Admin.
Please view or edit the original file there; changes should be reflected here after a midnight build (CET time),
or manually triggering it with a GitHub action (link).
Metrics QA for Indonesia Oil palm
Here I check
- trends,
- compare metrics between datasets
- (tbd compare metrics between the new updated metrics and the previous metrics )
at country level and/or island level (coming from jasons prodctions data)
Relevant metrics are:
- territorial palm deforestation (lag3 Agg10 and current lag3 Agg1)
- territorial deforestation similar to current palm deforestation (lag and aggregation period)
- territorial deforestation (gaveau)
- territorial deforestation (JRC vancutsem)
- territorial forest area (gaveau)
- territorial forest area (JRC vancutsem)
- palm area HA
- palm production (t)
- palm on peat area
- burned and peat area
checking key metrics to previous data
- palm area and tons
- palm deforestation
- peat area
## # A tibble: 273,493 × 11
##    conc_code ffb_code  kab          kab_code kec_code prov_code ind_palm_ha
##    <chr>     <chr>     <chr>           <dbl> <chr>        <dbl>       <dbl>
##  1 <NA>      FFB-03178 LOMBOK BARAT     5201 52.01.02        52           0
##  2 <NA>      FFB-03178 LOMBOK BARAT     5201 52.01.02        52           0
##  3 <NA>      FFB-03178 LOMBOK BARAT     5201 52.01.02        52           0
##  4 <NA>      FFB-03178 LOMBOK BARAT     5201 52.01.02        52           0
##  5 <NA>      FFB-03178 LOMBOK BARAT     5201 52.01.02        52           0
##  6 <NA>      FFB-03178 LOMBOK BARAT     5201 52.01.02        52           0
##  7 <NA>      FFB-03178 LOMBOK BARAT     5201 52.01.02        52           0
##  8 <NA>      FFB-03178 LOMBOK BARAT     5201 52.01.02        52           0
##  9 <NA>      FFB-03178 LOMBOK BARAT     5201 52.01.02        52           0
## 10 <NA>      FFB-03178 LOMBOK BARAT     5201 52.01.02        52           0
## # ℹ 273,483 more rows
## # ℹ 4 more variables: YEAR_PLANTING <dbl>, YEAR_HARVEST <dbl>,
## #   sml_palm_ha <dbl>, palm_ha <dbl>

##   conc_code           ffb_code             kab               kab_code
##  Length:261602      Length:261602      Length:261602      Min.   :1101
##  Class :character   Class :character   Class :character   1st Qu.:1607
##  Mode  :character   Mode  :character   Mode  :character   Median :3517
##                                                           Mean   :4460
##                                                           3rd Qu.:6405
##                                                           Max.   :9471
##    kec_code           prov_code     ind_palm_ha       YEAR_PLANTING
##  Length:261602      Min.   :11.0   Min.   :    0.00   Min.   :2000
##  Class :character   1st Qu.:16.0   1st Qu.:    0.00   1st Qu.:2005
##  Mode  :character   Median :35.0   Median :    0.00   Median :2010
##                     Mean   :44.5   Mean   :  634.08   Mean   :2010
##                     3rd Qu.:64.0   3rd Qu.:    0.47   3rd Qu.:2016
##                     Max.   :94.0   Max.   :69473.67   Max.   :2021
##   YEAR_HARVEST   sml_palm_ha          palm_ha
##  Min.   :2003   Min.   :    0.00   Min.   :     0.0
##  1st Qu.:2008   1st Qu.:    0.00   1st Qu.:     0.0
##  Median :2014   Median :    0.00   Median :     0.0
##  Mean   :2014   Mean   :  442.87   Mean   :  1076.9
##  3rd Qu.:2019   3rd Qu.:   68.75   3rd Qu.:   311.2
##  Max.   :2024   Max.   :69752.45   Max.   :103134.1

## # A tibble: 18 × 5
##    YEAR_HARVEST curr_PALM_HA prev_PALM_HA difference_ha difference_perc
##           <dbl>        <dbl>        <dbl>         <dbl>           <dbl>
##  1         2003     7893454.      7758250       135204.            1.74
##  2         2004     8083304.      7947517       135787.            1.71
##  3         2005     8285916.      8150295       135621.            1.66
##  4         2006     8416627.      8279138       137489.            1.66
##  5         2007     8849968.      8708747       141221.            1.62
##  6         2008     9361714.      9217076       144638.            1.57
##  7         2009     9954473.      9807386       147087.            1.50
##  8         2010    10548446.     10396177       152269.            1.46
##  9         2011    11259095.     11102275       156820.            1.41
## 10         2012    12104569.     11937739       166830.            1.40
## 11         2013    12683308.     12508078       175230.            1.40
## 12         2014    13366922.     13181424       185498.            1.41
## 13         2015    14184254.     13980744       203510.            1.46
## 14         2016    14771821.     14556713       215108.            1.48
## 15         2017    15290078.     15067018       223060.            1.48
## 16         2018    15660552.     15427909       232643.            1.51
## 17         2019    15933180.     15687632       245548.            1.57
## 18         2020    16146427.     15895357       251070.            1.58
## # A tibble: 30 × 16
##    conc_code.x ffb_code  kab      kab_code kec_code.x prov_code ind_palm_ha
##    <chr>       <chr>     <chr>       <dbl> <chr>          <dbl>       <dbl>
##  1 GFW0214     FFB-08724 KETAPANG     6106 61.04.04          61           0
##  2 GFW0214     FFB-08724 KETAPANG     6106 61.04.04          61           0
##  3 GFW0214     FFB-08724 KETAPANG     6106 61.04.04          61           0
##  4 GFW0214     FFB-08724 KETAPANG     6106 61.04.04          61           0
##  5 GFW0214     FFB-08724 KETAPANG     6106 61.04.04          61           0
##  6 GFW0214     FFB-08724 KETAPANG     6106 61.04.04          61           0
##  7 GFW0214     FFB-08724 KETAPANG     6106 61.04.04          61           0
##  8 GFW0214     FFB-08724 KETAPANG     6106 61.04.04          61           0
##  9 GFW0214     FFB-08724 KETAPANG     6106 61.04.04          61           0
## 10 GFW0214     FFB-08724 KETAPANG     6106 61.04.04          61           0
## # ℹ 20 more rows
## # ℹ 9 more variables: YEAR_PLANTING <dbl>, YEAR_HARVEST <dbl>,
## #   sml_palm_ha <dbl>, palm_ha <dbl>, conc_code.y <chr>, kec_code.y <chr>,
## #   variable <chr>, prev_PALM_HA <dbl>, trase_id <chr>
here I find individual differences, that may affect embedding of the new data into the previous models
## # A tibble: 3 × 3
##    YEAR    ann     tot
##   <dbl>  <dbl>   <dbl>
## 1  2018 159627 1596270
## 2  2019 152318 1523180
## 3  2020 145607 1456070

## # A tibble: 3 × 3
## # Groups:   year [3]
##    year variable           ann
##   <dbl> <chr>            <dbl>
## 1  2018 popdgaveau_2018 159627
## 2  2019 popdgaveau_2019 152318
## 3  2020 popdgaveau_2020 145607

## # A tibble: 3 × 4
##    YEAR    total      ind     sml
##   <dbl>    <dbl>    <dbl>   <dbl>
## 1  2018 2155872. 1611517. 544354.
## 2  2019 2037512. 1537911. 499601.
## 3  2020 1929894. 1471259. 458634.

## # A tibble: 273,493 × 11
##    conc_code ffb_code  kab          kab_code kec_code prov_code ind_palm_ha
##    <chr>     <chr>     <chr>           <dbl> <chr>        <dbl>       <dbl>
##  1 <NA>      FFB-03178 LOMBOK BARAT     5201 52.01.02        52           0
##  2 <NA>      FFB-03178 LOMBOK BARAT     5201 52.01.02        52           0
##  3 <NA>      FFB-03178 LOMBOK BARAT     5201 52.01.02        52           0
##  4 <NA>      FFB-03178 LOMBOK BARAT     5201 52.01.02        52           0
##  5 <NA>      FFB-03178 LOMBOK BARAT     5201 52.01.02        52           0
##  6 <NA>      FFB-03178 LOMBOK BARAT     5201 52.01.02        52           0
##  7 <NA>      FFB-03178 LOMBOK BARAT     5201 52.01.02        52           0
##  8 <NA>      FFB-03178 LOMBOK BARAT     5201 52.01.02        52           0
##  9 <NA>      FFB-03178 LOMBOK BARAT     5201 52.01.02        52           0
## 10 <NA>      FFB-03178 LOMBOK BARAT     5201 52.01.02        52           0
## # ℹ 273,483 more rows
## # ℹ 4 more variables: YEAR_PLANTING <dbl>, YEAR_HARVEST <dbl>,
## #   sml_palm_ha <dbl>, palm_ha <dbl>

##   conc_code           ffb_code             kab               kab_code
##  Length:225929      Length:225929      Length:225929      Min.   :1101
##  Class :character   Class :character   Class :character   1st Qu.:1607
##  Mode  :character   Mode  :character   Mode  :character   Median :3517
##                                                           Mean   :4460
##                                                           3rd Qu.:6405
##                                                           Max.   :9471
##    kec_code           prov_code     ind_palm_ha      YEAR_PLANTING
##  Length:225929      Min.   :11.0   Min.   :    0.0   Min.   :2000
##  Class :character   1st Qu.:16.0   1st Qu.:    0.0   1st Qu.:2004
##  Mode  :character   Median :35.0   Median :    0.0   Median :2009
##                     Mean   :44.5   Mean   :  595.2   Mean   :2009
##                     3rd Qu.:64.0   3rd Qu.:    0.0   3rd Qu.:2014
##                     Max.   :94.0   Max.   :69473.7   Max.   :2018
##   YEAR_HARVEST   sml_palm_ha          palm_ha
##  Min.   :2003   Min.   :    0.00   Min.   :    0.0
##  1st Qu.:2007   1st Qu.:    0.00   1st Qu.:    0.0
##  Median :2012   Median :    0.00   Median :    0.0
##  Mean   :2012   Mean   :  419.00   Mean   : 1014.2
##  3rd Qu.:2017   3rd Qu.:   61.72   3rd Qu.:  263.4
##  Max.   :2021   Max.   :61915.21   Max.   :95497.5

## # A tibble: 35,673 × 10
##    ffb_code  kab_code prov_code YEAR_HARVEST ind_palm_ha sml_palm_ha palm_ha
##    <chr>        <dbl>     <dbl>        <dbl>       <dbl>       <dbl>   <dbl>
##  1 FFB-03178     5201        52         2018           0           0       0
##  2 FFB-03178     5201        52         2019           0           0       0
##  3 FFB-03178     5201        52         2020           0           0       0
##  4 FFB-03179     5201        52         2018           0           0       0
##  5 FFB-03179     5201        52         2019           0           0       0
##  6 FFB-03179     5201        52         2020           0           0       0
##  7 FFB-03180     5201        52         2018           0           0       0
##  8 FFB-03180     5201        52         2019           0           0       0
##  9 FFB-03180     5201        52         2020           0           0       0
## 10 FFB-03181     5201        52         2018           0           0       0
## # ℹ 35,663 more rows
## # ℹ 3 more variables: value <dbl>, palm_area_diff_ha <dbl>,
## #   palm_area_diff_perc <dbl>

## # A tibble: 11,891 × 10
##    ffb_code  kab_code prov_code YEAR_HARVEST ind_palm_ha sml_palm_ha palm_ha
##    <chr>        <dbl>     <dbl>        <dbl>       <dbl>       <dbl>   <dbl>
##  1 FFB-03178     5201        52         2016           0           0       0
##  2 FFB-03179     5201        52         2016           0           0       0
##  3 FFB-03180     5201        52         2016           0           0       0
##  4 FFB-03181     5201        52         2016           0           0       0
##  5 FFB-03182     5201        52         2016           0           0       0
##  6 FFB-03183     5201        52         2016           0           0       0
##  7 FFB-03184     5201        52         2016           0           0       0
##  8 FFB-03185     5201        52         2016           0           0       0
##  9 FFB-03186     5201        52         2016           0           0       0
## 10 FFB-03187     5201        52         2016           0           0       0
## # ℹ 11,881 more rows
## # ℹ 3 more variables: value <dbl>, palm_area_diff_ha <dbl>,
## #   palm_area_diff_perc <dbl>

## # A tibble: 4 × 10
##   YEAR_HARVEST n_inf n_is_na mean_diff median_diff mean_dif_perc med_dif_perc
##          <dbl> <int>   <int>     <dbl>       <dbl>         <dbl>        <dbl>
## 1         2017    99       0      18.8           0           Inf        0.290
## 2         2018   102       0      19.6           0           Inf        0.290
## 3         2019    99       0      20.6           0           Inf        0.286
## 4         2020    97       0      21.1           0           Inf        0.293
## # ℹ 3 more variables: max_dif_perc <dbl>, min_dif_perc <dbl>, sd_dif_perc <dbl>

##    ffb_code            kab_code      prov_code     YEAR_HARVEST
##  Length:214038      Min.   :1101   Min.   :11.0   Min.   :2003
##  Class :character   1st Qu.:1607   1st Qu.:16.0   1st Qu.:2007
##  Mode  :character   Median :3517   Median :35.0   Median :2012
##                     Mean   :4460   Mean   :44.5   Mean   :2012
##                     3rd Qu.:6405   3rd Qu.:64.0   3rd Qu.:2016
##                     Max.   :9471   Max.   :94.0   Max.   :2020
##
##   ind_palm_ha       sml_palm_ha          palm_ha            value
##  Min.   :    0.0   Min.   :    0.00   Min.   :    0.0   Min.   :    0.0
##  1st Qu.:    0.0   1st Qu.:    0.00   1st Qu.:    0.0   1st Qu.:    0.0
##  Median :    0.0   Median :    0.00   Median :    0.0   Median :    0.0
##  Mean   :  580.4   Mean   :  413.80   Mean   :  994.2   Mean   :  979.3
##  3rd Qu.:    0.0   3rd Qu.:   60.34   3rd Qu.:  249.9   3rd Qu.:  232.0
##  Max.   :69473.7   Max.   :61492.09   Max.   :94934.8   Max.   :91037.0
##
##  palm_area_diff_ha   palm_area_diff_perc
##  Min.   :-18393.00   Min.   :-100.00
##  1st Qu.:     0.00   1st Qu.:   0.00
##  Median :     0.00   Median :   0.32
##  Mean   :    14.88   Mean   :    Inf
##  3rd Qu.:     1.00   3rd Qu.:   3.19
##  Max.   :  6606.00   Max.   :    Inf
##                      NA's   :126329

## # A tibble: 3 × 6
##   YEAR_HARVEST mean_dif_perc med_dif_perc max_dif_perc min_dif_perc sd_dif_perc
##          <dbl>         <dbl>        <dbl>        <dbl>        <dbl>       <dbl>
## 1         2018          40.0         1.21         936.        -1.16        180.
## 2         2019          40.1         1.29         938.        -2.10        180.
## 3         2020          40.2         1.30         941.        -2.10        181.

## # A tibble: 3 × 5
##   YEAR_HARVEST   palm_ha    value palm_area_diff_ha palm_area_diff_perc
##          <dbl>     <dbl>    <dbl>             <dbl>               <dbl>
## 1         2018 15660552. 15427909           232643.                1.51
## 2         2019 15933180. 15687632           245548.                1.57
## 3         2020 16146427. 15895357           251070.                1.58

## # A tibble: 3 × 6
##    YEAR BURNED_HA_nr BURNED_HA_r   value     n      perc
##   <dbl>        <dbl>       <dbl>   <dbl> <int>     <dbl>
## 1  2018      571665.      571694  521297 11891  0.00499
## 2  2019     1765473.     1765456 1635132 11891 -0.000953
## 3  2020      332011.      332004  291272 11891 -0.00218

##  conc_code.x          ffb_code             kab               kab_code
##  Length:71346       Length:71346       Length:71346       Min.   :1101
##  Class :character   Class :character   Class :character   1st Qu.:1607
##  Mode  :character   Mode  :character   Mode  :character   Median :3517
##                                                           Mean   :4460
##                                                           3rd Qu.:6405
##                                                           Max.   :9471
##   kec_code.x          prov_code      BURNED_HA              YEAR
##  Length:71346       Min.   :11.0   Min.   :     0.00   Min.   :2015
##  Class :character   1st Qu.:16.0   1st Qu.:     0.00   1st Qu.:2016
##  Mode  :character   Median :35.0   Median :     0.00   Median :2018
##                     Mean   :44.5   Mean   :    83.66   Mean   :2018
##                     3rd Qu.:64.0   3rd Qu.:     0.00   3rd Qu.:2019
##                     Max.   :94.0   Max.   :116532.64   Max.   :2020
##  BURNED_PEAT_HA        PEAT_HA       conc_code.y         kec_code.y
##  Min.   :    0.00   Min.   :     0   Length:71346       Length:71346
##  1st Qu.:    0.00   1st Qu.:     0   Class :character   Class :character
##  Median :    0.00   Median :     0   Mode  :character   Mode  :character
##  Mean   :   21.74   Mean   :  1138
##  3rd Qu.:    0.00   3rd Qu.:     0
##  Max.   :60204.65   Max.   :280480
##    variable             value             trase_id
##  Length:71346       Min.   :     0.00   Length:71346
##  Class :character   1st Qu.:     0.00   Class :character
##  Mode  :character   Median :     0.00   Mode  :character
##                     Mean   :    78.77
##                     3rd Qu.:     0.00
##                     Max.   :115005.00

## # A tibble: 3 × 6
##    YEAR BURNED_HA_nr BURNED_HA_r   value     n      perc
##   <dbl>        <dbl>       <dbl>   <dbl> <int>     <dbl>
## 1  2018      571665.      571694  521297 11891  0.00499
## 2  2019     1765473.     1765456 1635132 11891 -0.000953
## 3  2020      332011.      332004  291272 11891 -0.00218
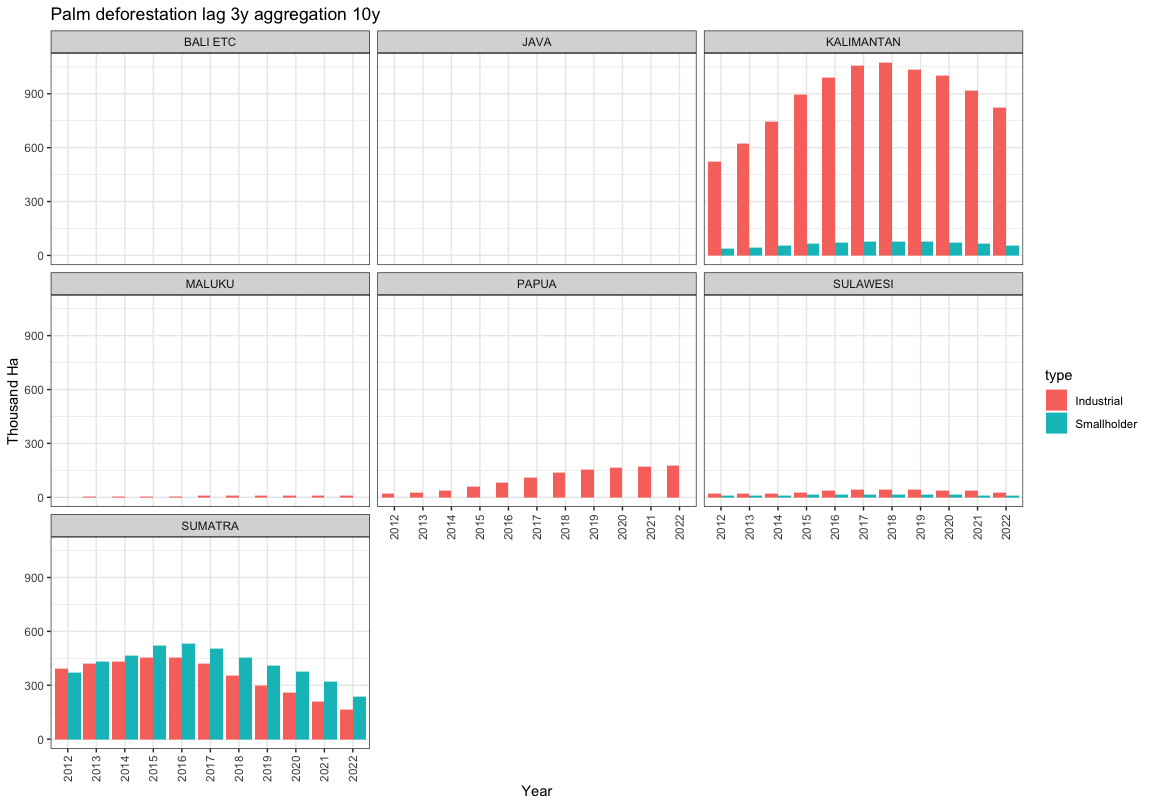
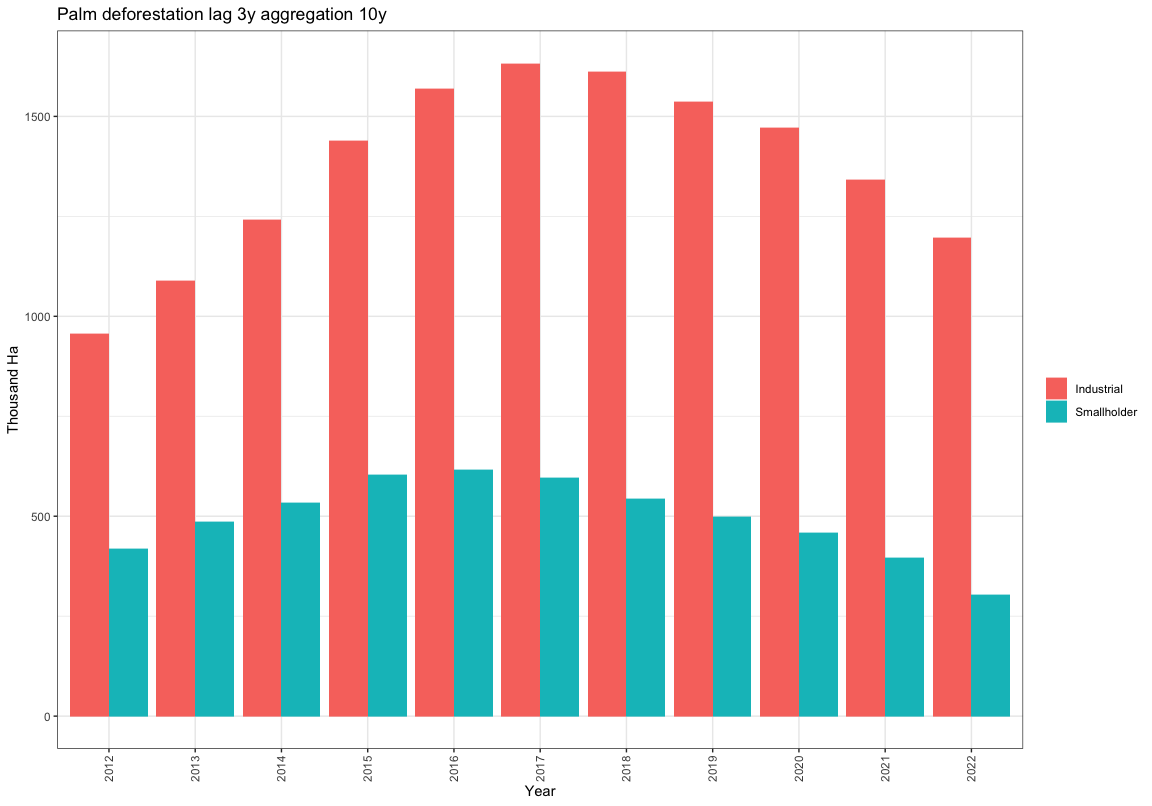
Palm deforestation
Trends of past palm deforestation using Gavou-TreeMap and 3 years lag, 10 year aggregation
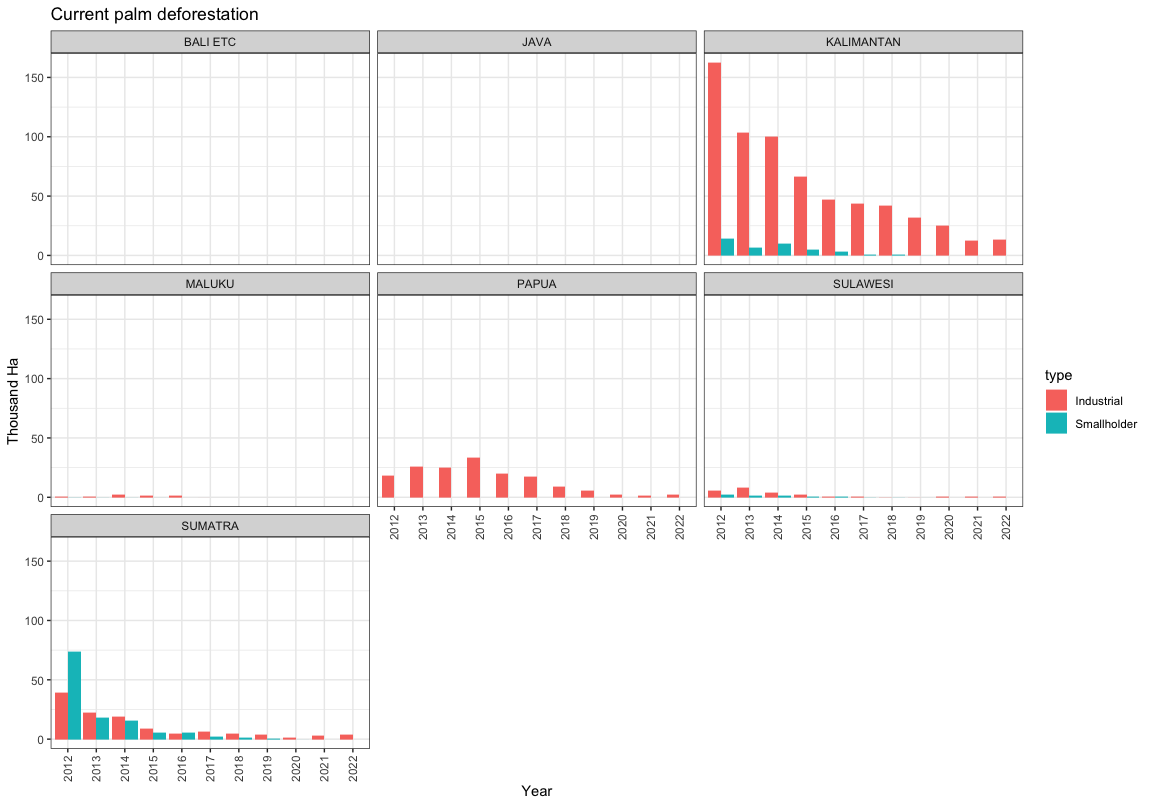
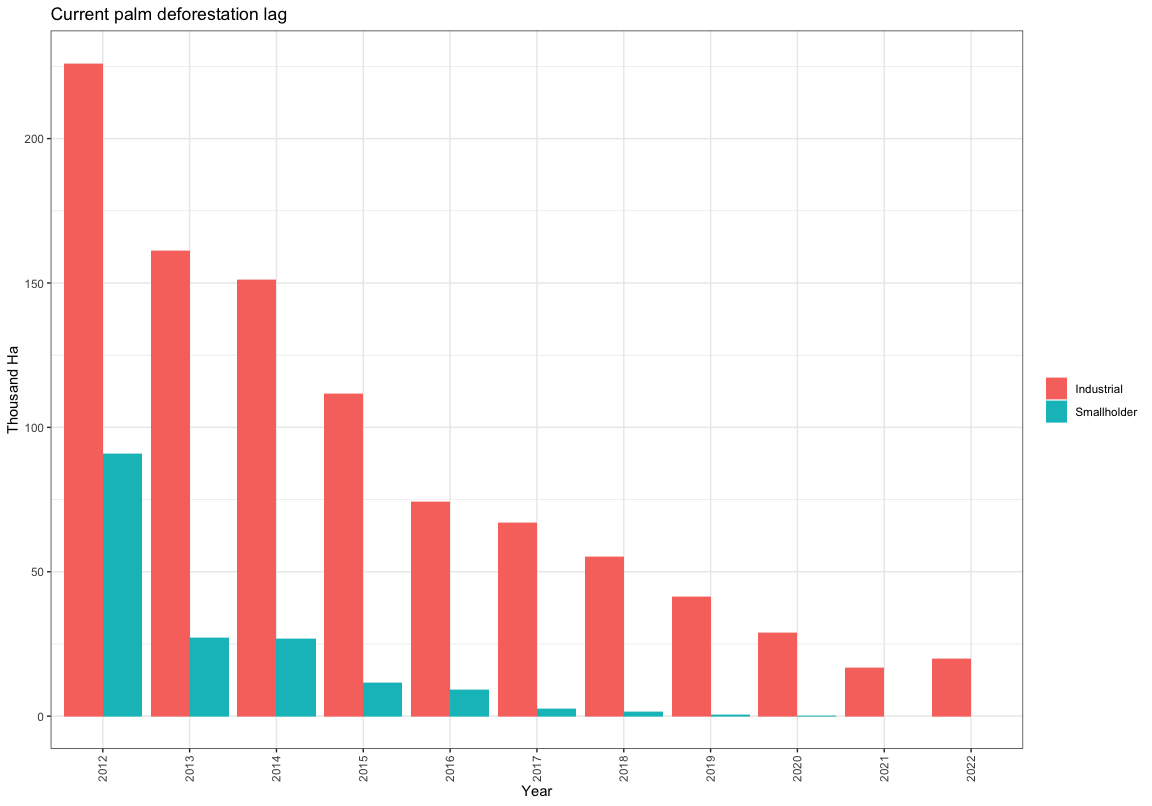
Trends of current palm deforestation using Gavou-TreeMap (no lag, 1 year aggregation)
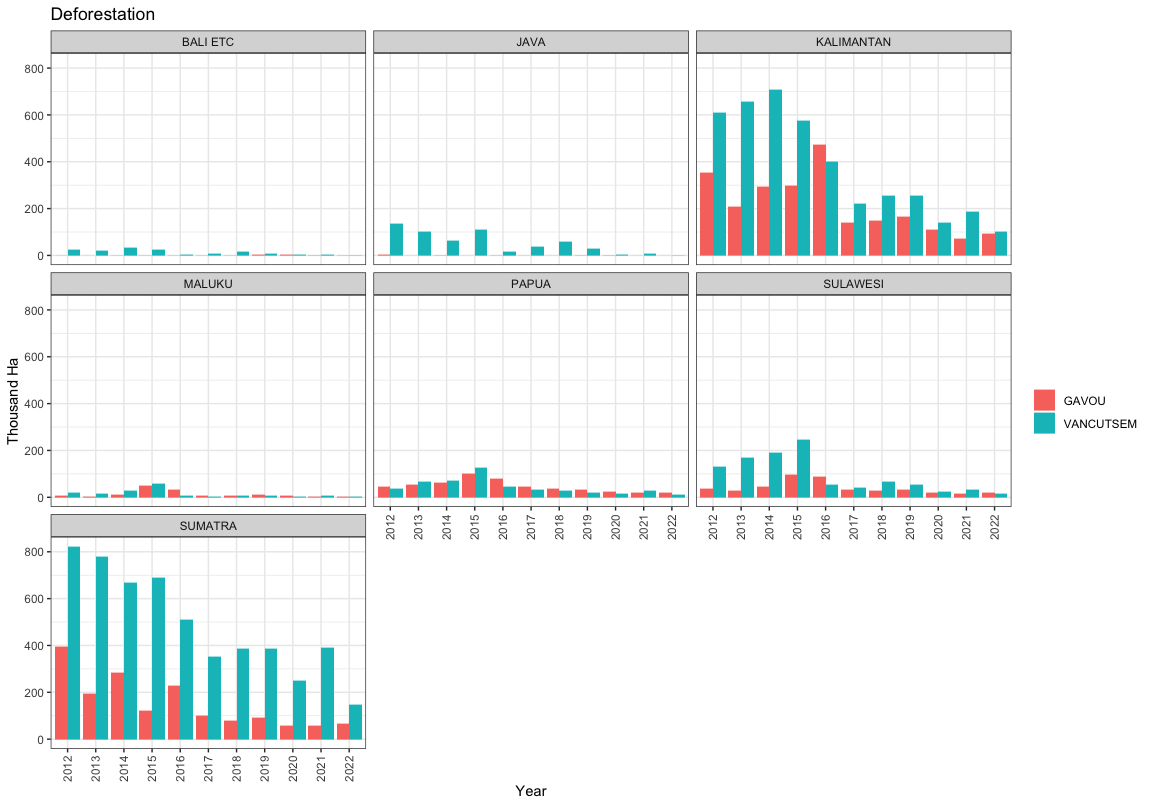
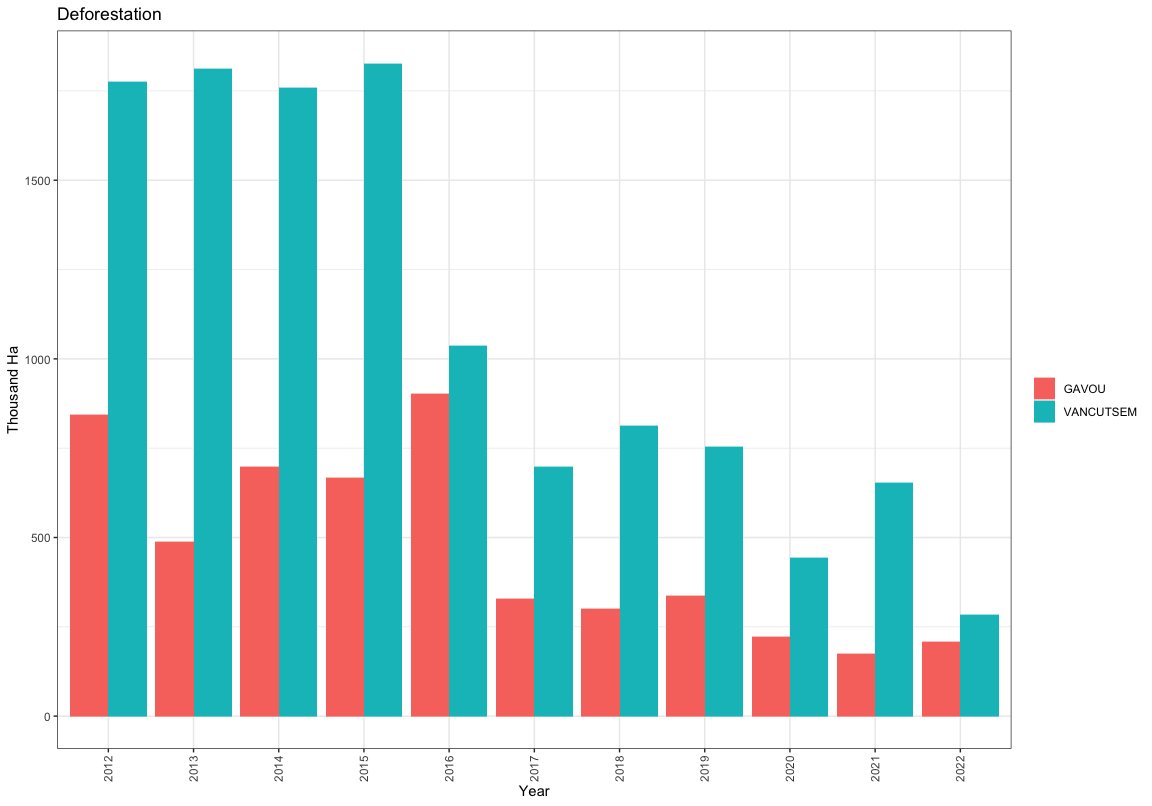
Overall deforestation by island and national
Trends in overal deforestation comparing Gavou-TreeMap and Vancutsem JRC-TMF
Comparing Gavou and Vancutem indicates that Gavou maps distinctly less overall deforestation. Trends are similar. I belive, Vancutsem is know to overestimate deforestation due to inclusion of shrublands ?
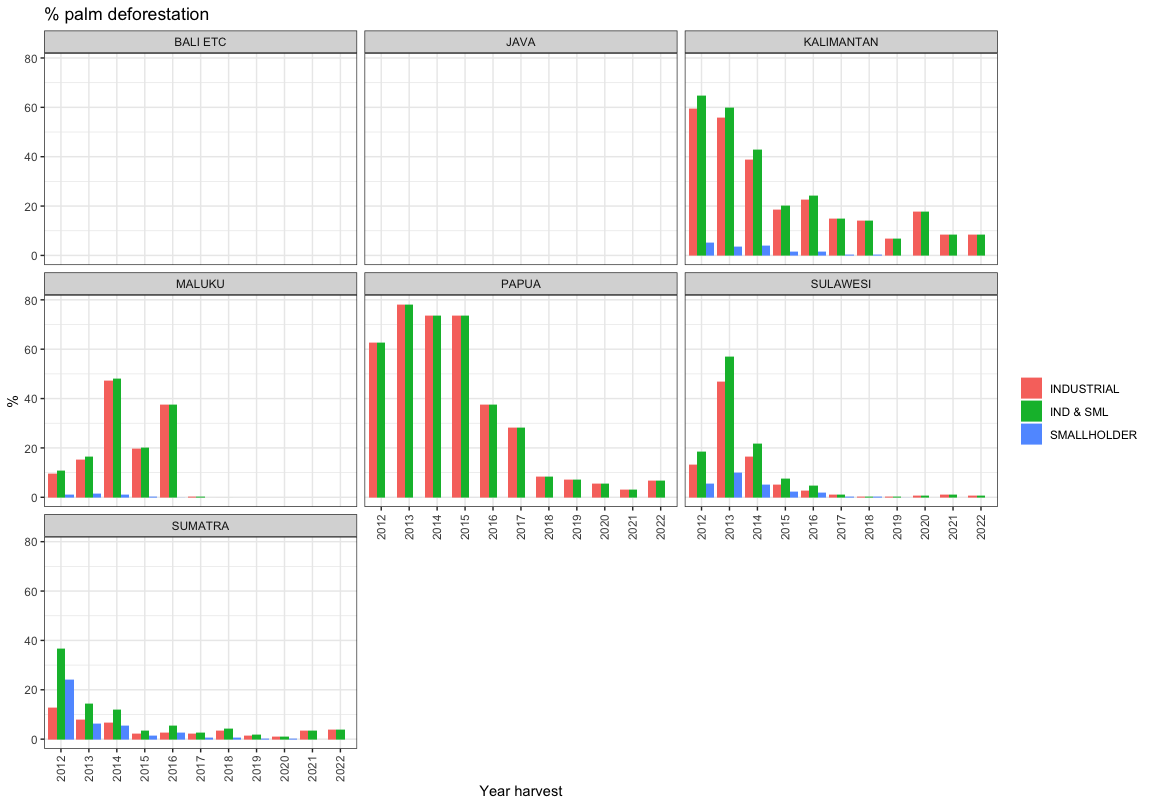
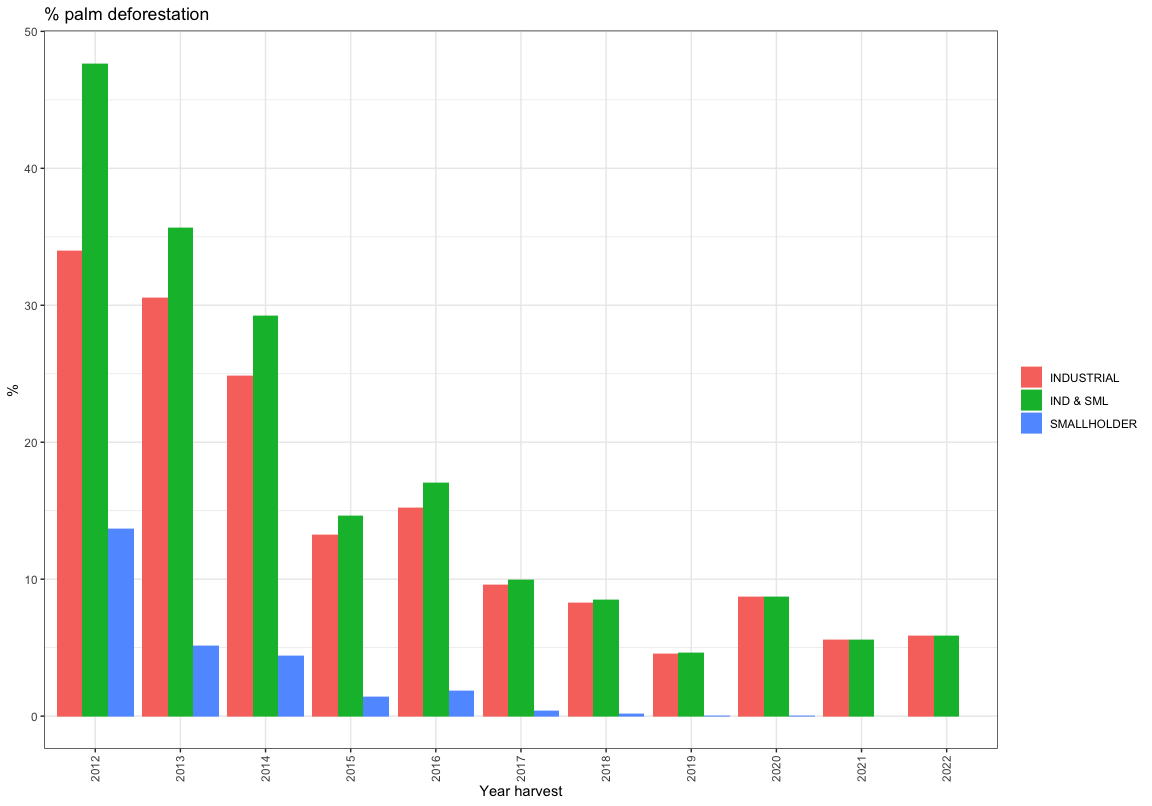
Percent palm deforestation
combining ‘active’/current palm deforestation (see above) and gavou deforestation using 3 year lag. Values are percent palm deforestation of total deforestation.
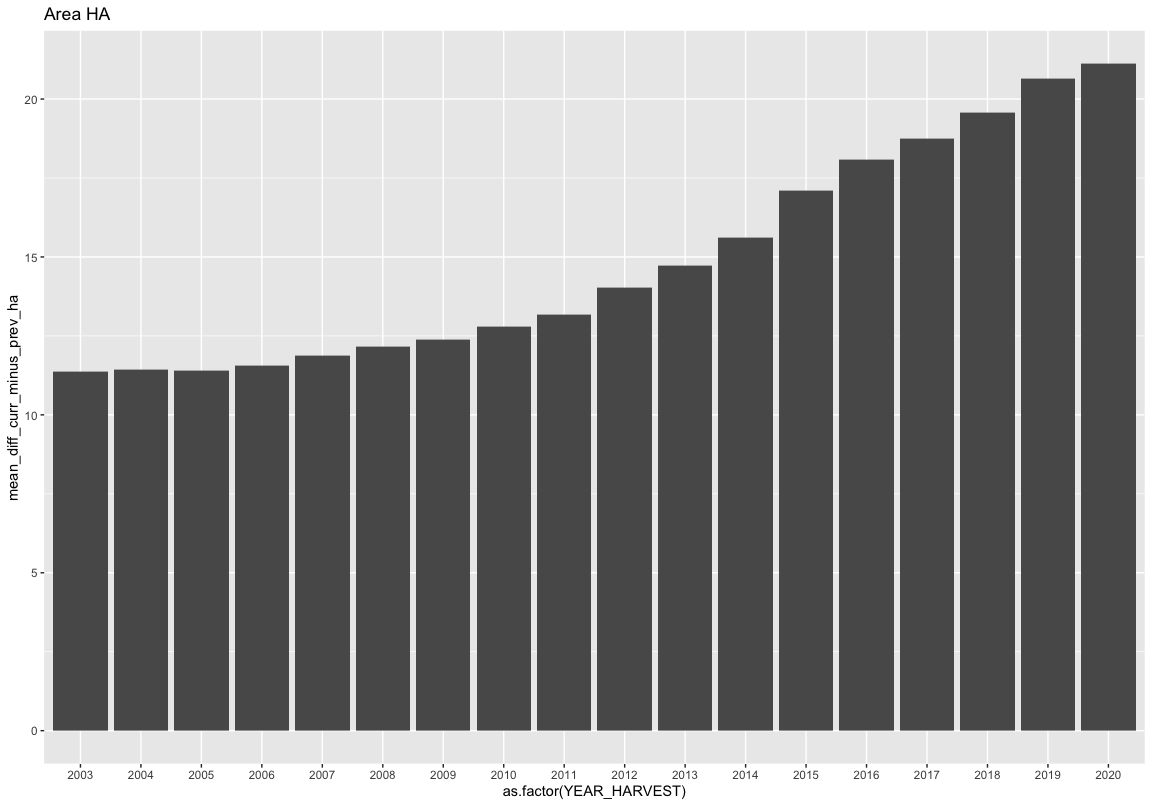
Forest area
Trends in overal forest area comparing Gavou-TreeMap and Vancutsem JRC-TMF
 There is more forest mapped by Vancutsem JRC-TMF
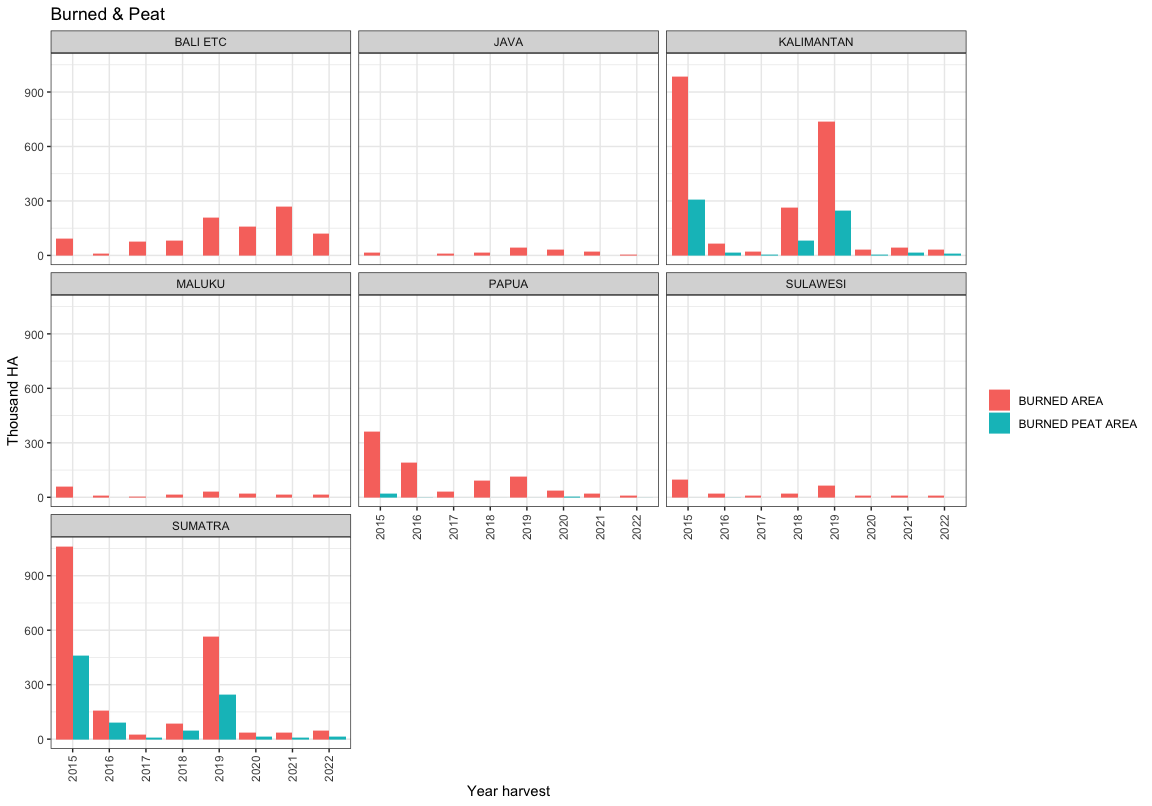
Burned & peat area trends
Burned area from MoEF and Indonesias oficial peat map (see woodpulp documentation)
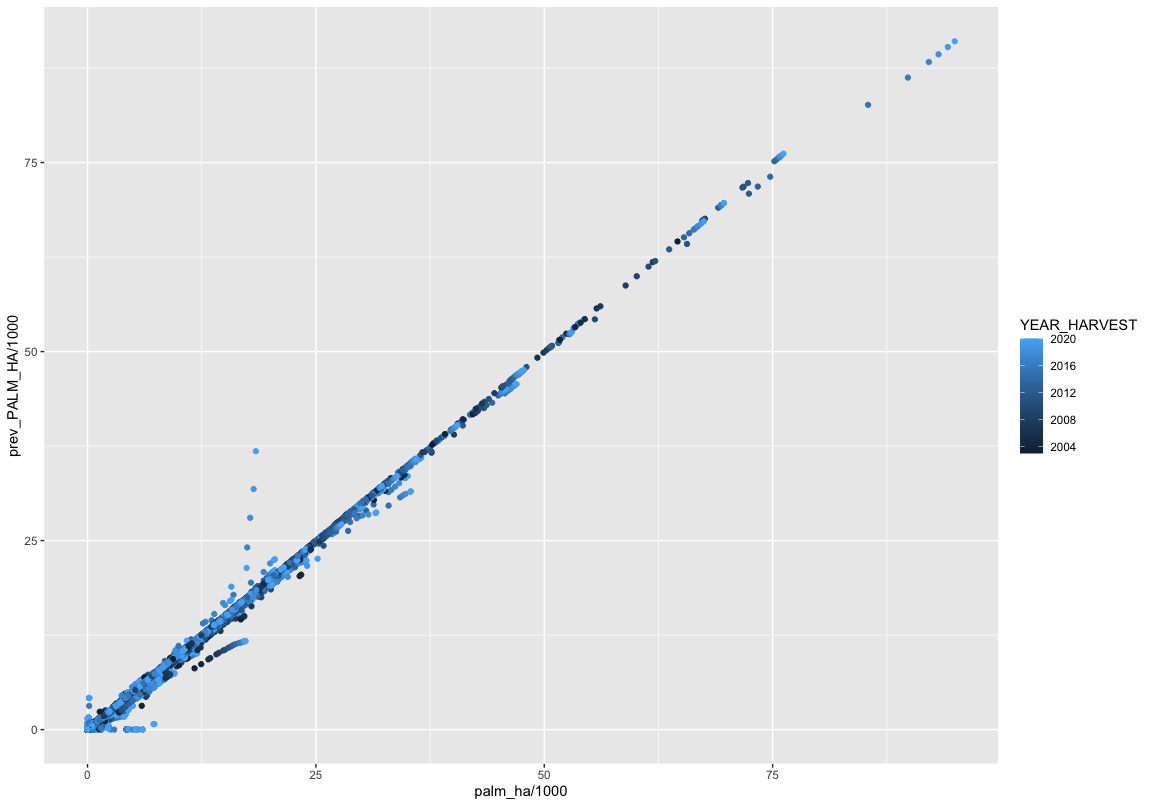
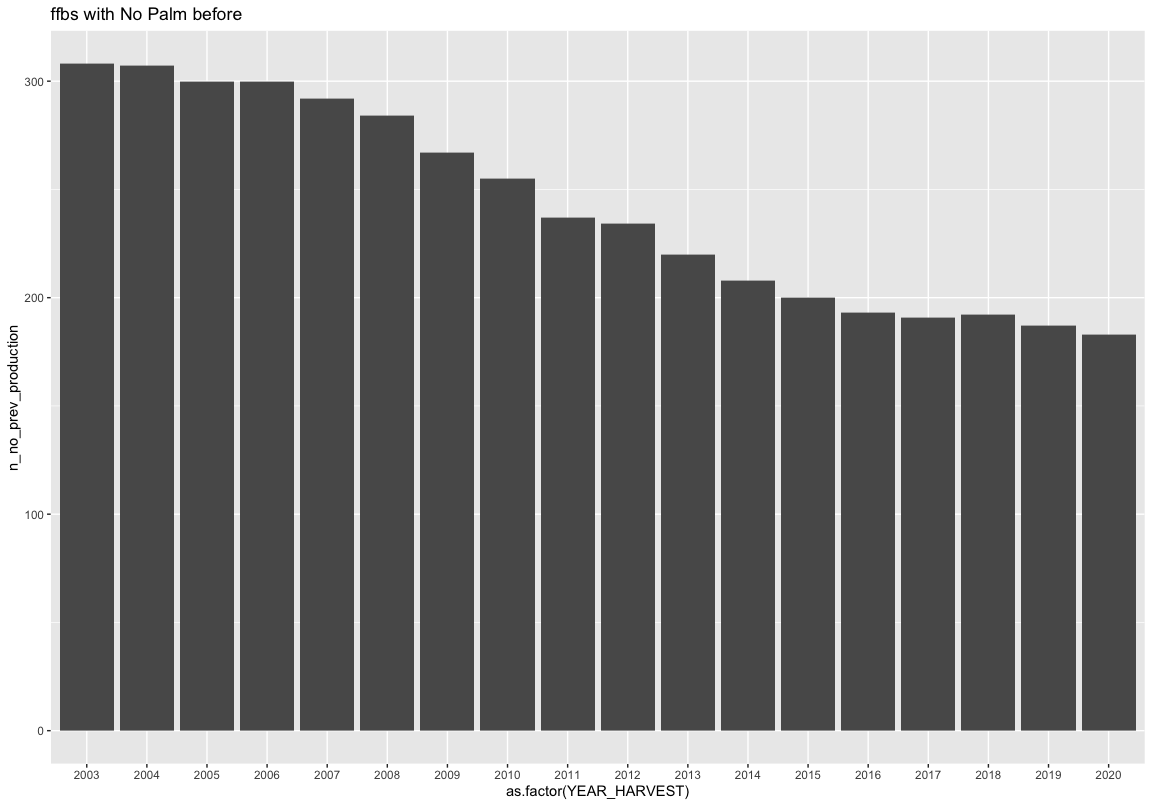
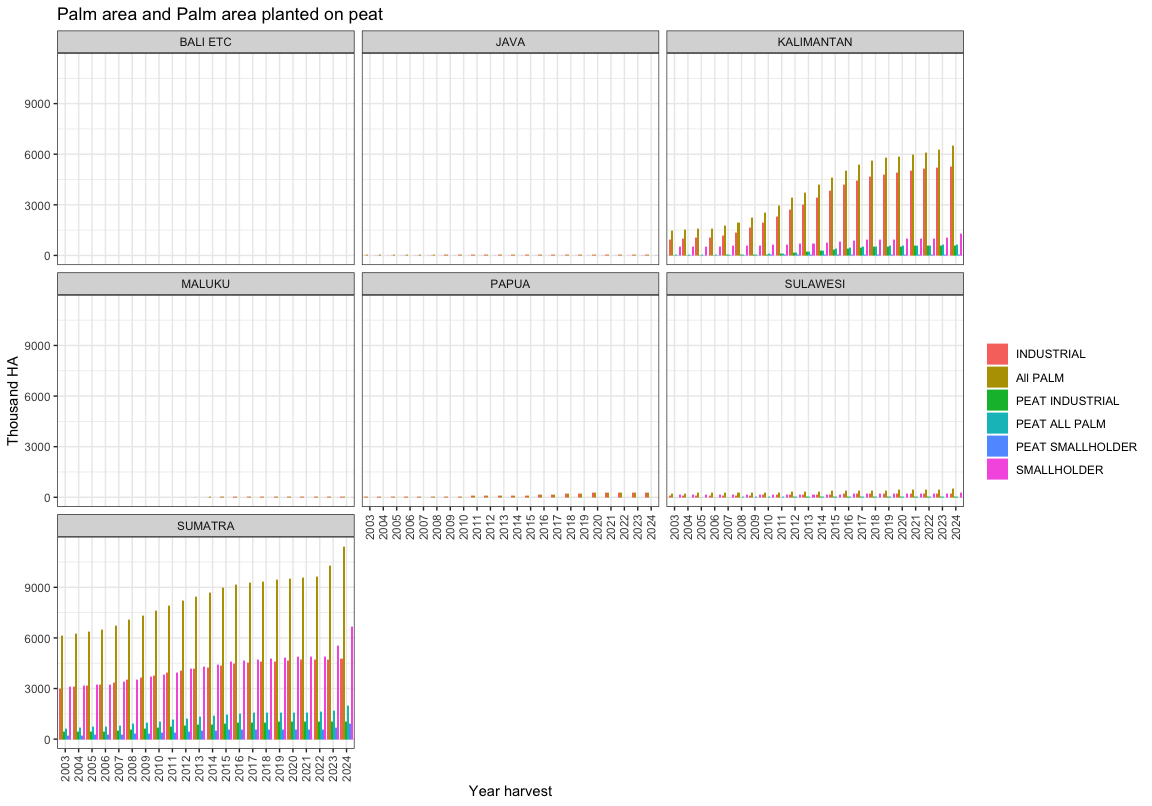
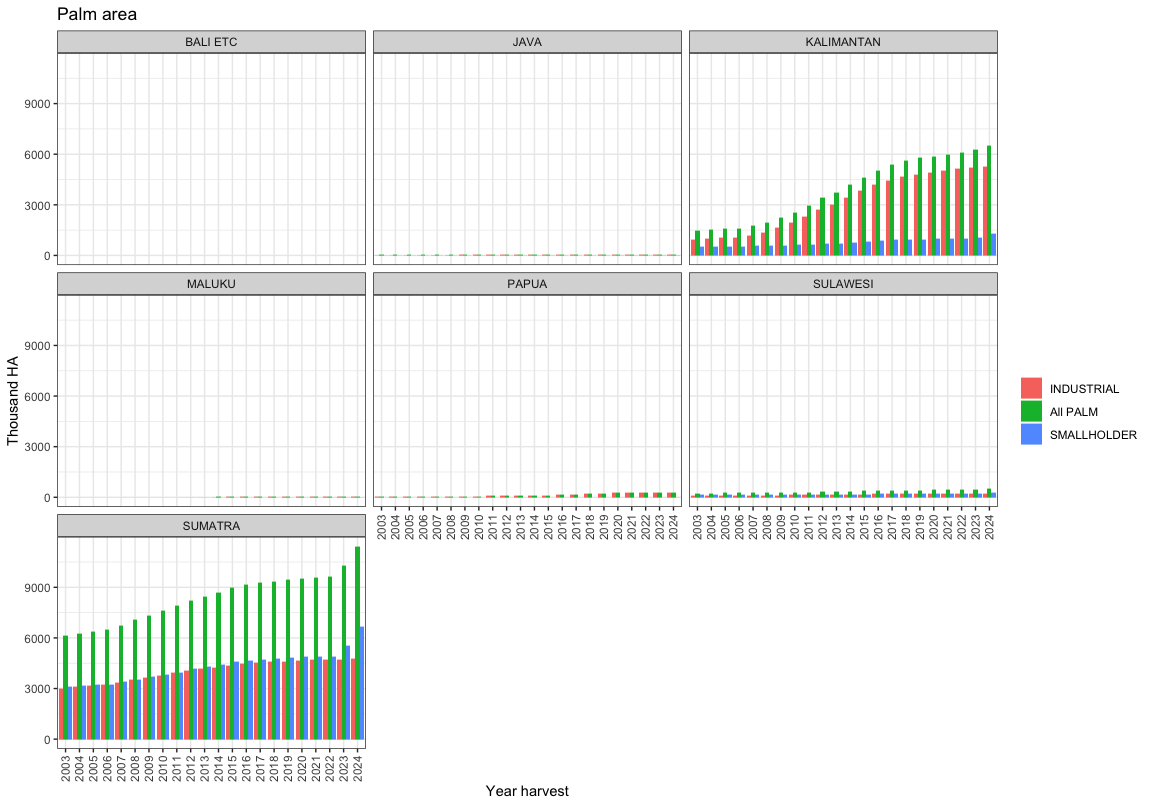
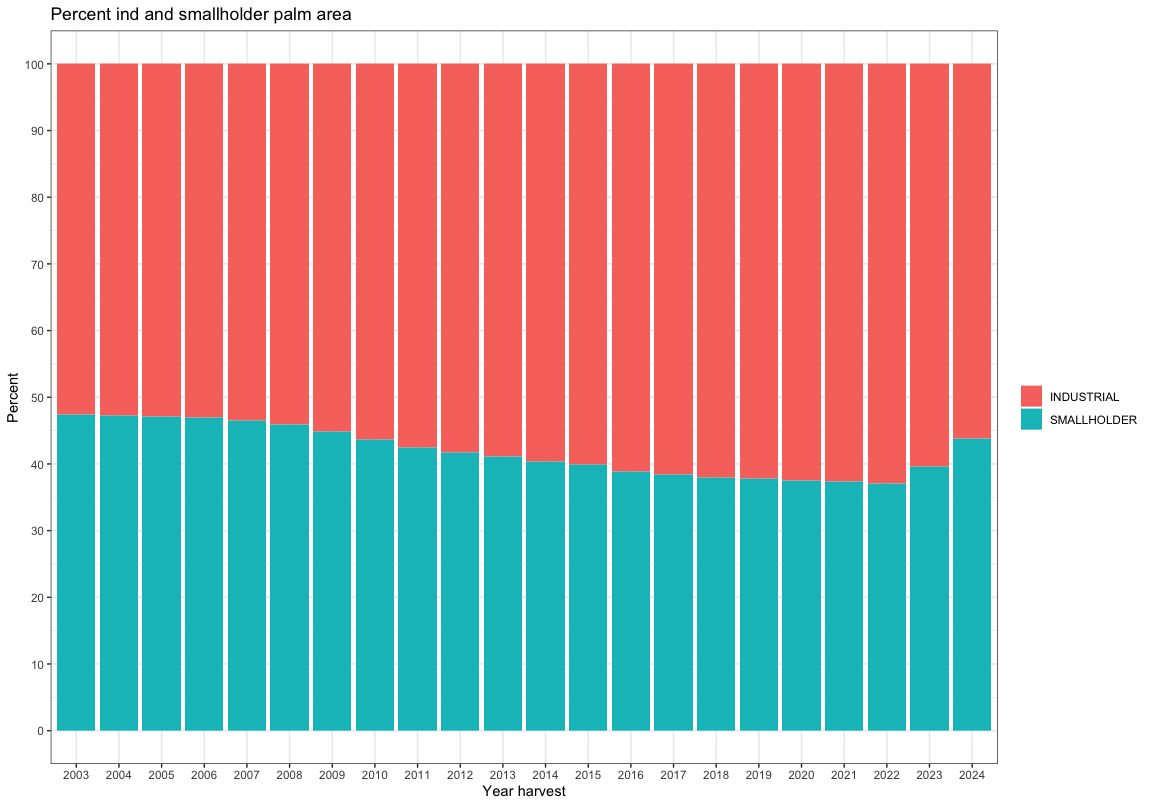
Palm & peat area
Palm area is based on:
- Industrial palm area Gavou TreeMap 2001-2022 or harvested 2004-2025
- Smalholder palm area 2001-2019 Gavou TreeMap (Harveste 2003-2022)
- Smalholder palm area 2020 Auriga (excluding Industrial area from Gavou) + areas mapped previously (Gavou) (Harveste 2023)
- Smalholder palm area 2021 MOA (excluding Industrial area from Gavou) + areas mapped previously (Gavou) (Harveste 2024)
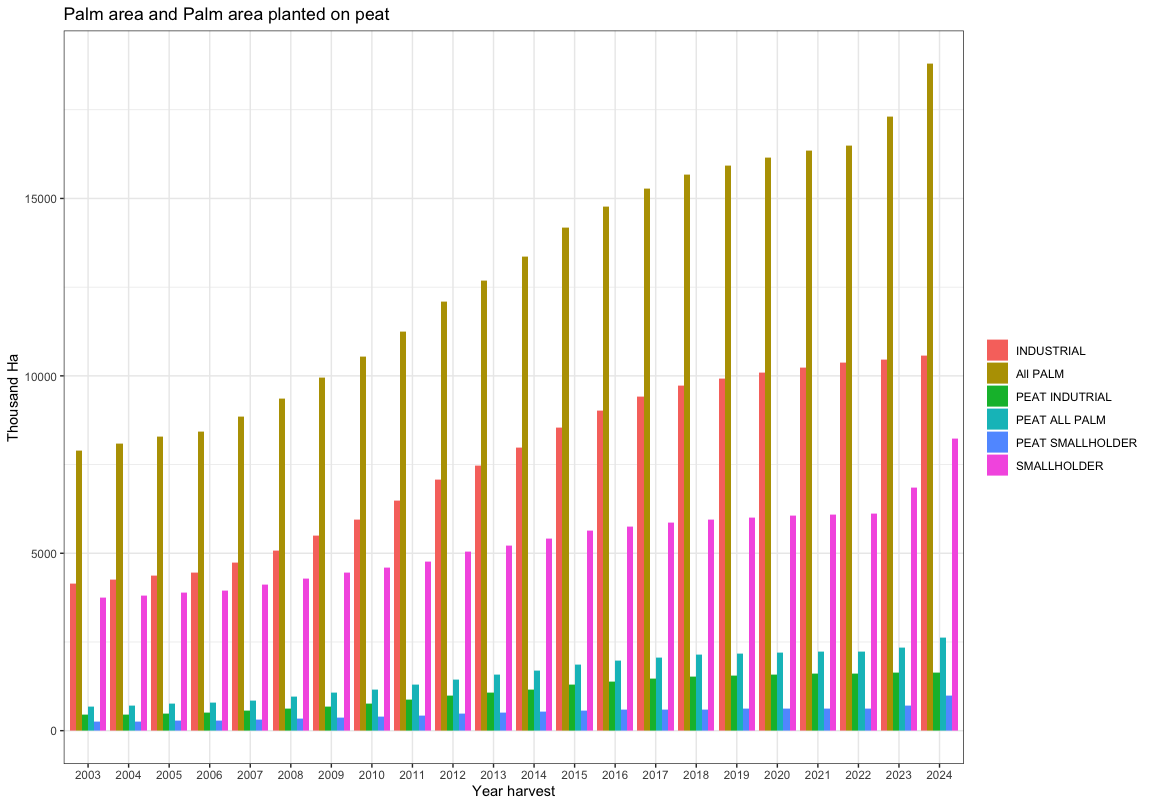
## # A tibble: 23 × 2
##    YEAR_HARVEST palm_mha
##           <dbl>    <dbl>
##  1         2003     7.89
##  2         2004     8.08
##  3         2005     8.29
##  4         2006     8.42
##  5         2007     8.85
##  6         2008     9.36
##  7         2009     9.95
##  8         2010    10.5
##  9         2011    11.3
## 10         2012    12.1
## # ℹ 13 more rows

## # A tibble: 23 × 2
##    YEAR_HARVEST peat_palm_mha
##           <dbl>         <dbl>
##  1         2003         0.687
##  2         2004         0.718
##  3         2005         0.758
##  4         2006         0.778
##  5         2007         0.861
##  6         2008         0.971
##  7         2009         1.07
##  8         2010         1.17
##  9         2011         1.31
## 10         2012         1.45
## # ℹ 13 more rows

## # A tibble: 3 × 3
## # Groups:   year [3]
##    year variable         peat_palm_mha
##   <dbl> <chr>                    <dbl>
## 1  2018 oilpalmpeat_2018          2.27
## 2  2019 oilpalmpeat_2019          2.30
## 3  2020 oilpalmpeat_2020          2.34
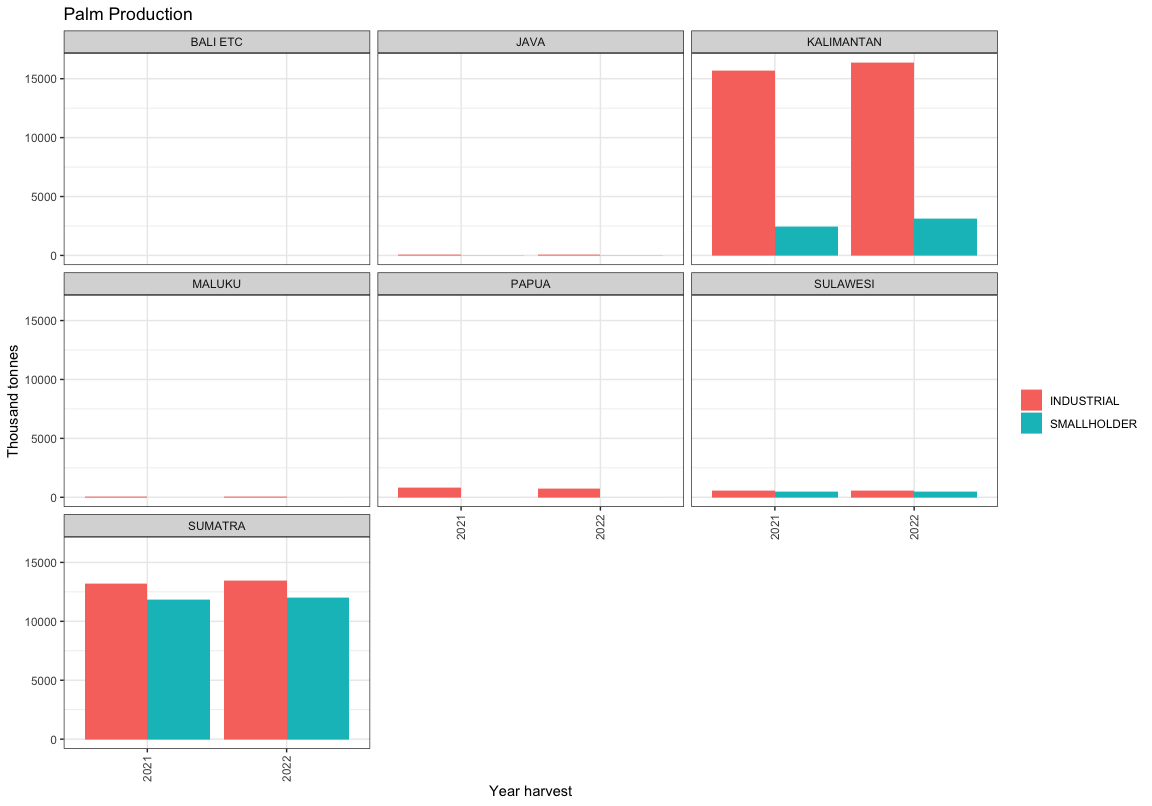
Palm production tons
Based on palm area palm suitability and production tons per island (calculated by Jason)